Data Highlights
Global capture landings
96.4 million tonnes (2018)
FAO, 2020
Global aquaculture production
82.1 million tonnes (2018)
FAO, 2020
Per capita fish consumption
20.5 kg (2018)
FAO, 2020
Jump to:
This chapter is divided into two parts: a) unsustainable fishing, and b) unsustainable farming (i.e., aquaculture).
Unsustainable Fishing
Unsustainable fishing practices threaten marine wildlife as well as the livelihoods and food supply of many vulnerable populations. These threats manifest through overfishing; illegal, unreported and unregulated fishing; bycatch (incidental capture); destructive habitat impacts; poor governance and regulatory systems; human rights and labor abuses; and reductions in food security. In some cases, aquaculture, or farming of fish and other seafood, can provide a solution to help meet growing global demand for seafood. However, unsustainable farming practices can present their own environmental challenges—including habitat destruction, contamination of native wild fish populations, disease spread, and pollution into the ocean—as well as human health and labor abuse concerns.
Global Production Trends
The Food and Agriculture Organization (FAO) reports that global marine landings were 93 million tons in 2016, a roughly consistent level over the last twenty years.1 The FAO determines landings primarily based on self-reporting by country governments, which means its statistics are largely dependent on the accuracy and reliability of national-level data.
Two other sources, Sea Around Us2 and Watson and Tidd (2018)3, attempt to correct for possible gaps in this approach by using catch reconstruction methodologies. Catch reconstructions include difficult-to-monitor categories such as artisanal landings, discards, and illegal fishing to approximate the amount of fish removed from the ocean each year. Incorporating these unreported categories of catch places global landings approximately 20 to 35 percent higher than FAO’s officially reported figures.4 Both catch reconstruction methodologies suggest that total global catch has been on a slight downward trajectory since the mid-1990s, though without significant change in the last five years. This general decline is despite significant increases in overall fishing effort over the same period.5
Comparison of global marine capture estimates
An estimated 20 percent of global fish catch, representing 11-26 million tonnes of landings is caught illegally, accounting for an annual economic loss of USD 10-23.5 billion.6 According to data from Watson and Tidd (2018), which uses the same methodology, illegal and unreported fishing accounted for roughly 25 percent of landings in 2015 (representing 32 million tons); this level has been relatively stable in recent years.7 While these figures represent the best available global estimates, accurately determining the scale of IUU is a decisive challenge, which is one reason for the wide confidence intervals.
As wild capture landings plateaued in recent decades, a major redistribution of catch has taken place between developed and developing economies. Total landings in developed countries, primarily in North America and Europe, declined by a third since the late 1980s.8 Meanwhile developing economies (including China, Peru, and Russia) have seen consistent increases in catch—from representing 40 percent of global catch in 1980 to 65 percent in 2016.9
Estimates of unreported catch
Catch by country economic classification
Regionally, Asia has experienced the most notable expansion in catch, with a nine-fold increase since the 1950s. Since 2012, wild capture landings by Asian countries have exceeded landings by the rest of the world combined. In 2016, Asian countries accounted for 53 percent of global catch with China alone harvesting nearly one-fifth of global catch volume.10 Recent research suggests that the continued high productivity of some Asian fisheries is at least partly driven by heavy fishing pressure and speciation, the shift in ecosystem composition toward smaller, more productive species.11
Capture fisheries landings: Asia compared to the rest of the world
Global Stock Status
While the overall volume of global marine capture landings has not fluctuated significantly over the past thirty years, it does not follow that the state of fisheries resources is also stable. Official data from the FAO suggests that the status of global stocks is poor, ranking 33 percent of assessed major stocks as overfished in 2015 (the most recent published year).12 FAO data indicate that the portion of overfished stocks has steadily expanded over time—from 10 percent of stocks in 1975 to 33 percent in 2015—but has slightly stabilized in recent years.13 Most stocks remain unassessed, and more than half of monitored fisheries are depleted to the point of yielding little or no catch. The FAO has recorded an improvement in many mid- and high-latitude fish stocks over the past decade due to improved fisheries management.
Global stock status according to FAO
An alternative perspective, from the Sea Around Us, suggests that two-fifths of stocks—a slightly larger proportion than the FAO estimate—may be overfished or collapsed. However, data from Sea Around Us also indicate that the proportion of stocks undergoing rebuilding has increased slightly in recent years. The Sea Around Us data, which considers both assessed and unassessed stocks, suggests that 40 percent of stocks were overexploited or collapsed in 2014, the most recent published year. Its data indicate that the proportion of stocks currently rebuilding has been slowly increasing since the mid-1990s. As of 2014, 7.4 percent of stocks were classified as rebuilding; 8.6 percent as developing; 37 percent as exploited; 30 percent as overexploited; and 17 percent as collapsed.14
These companion charts show the percentage of stocks rebuilding, developing, exploited, over-exploited and collapsed. The top chart (Proportion of stocks by stock status) displays the overall health of stocks, weighting each stock equally, while the bottom chart (Proportion of catch by stock status) categories overall landings by volume according to stock status.
Proportion of stocks by stock status
Global charts depicting changes in stock status tend to mask notable regional variations. Available data suggests that in places where fisheries management is sufficient, managed stocks are improving and overfishing is decreasing.15 In places where the strength of fisheries management is low, stock status may be worse than official sources such as the FAO suggest.16 This implies that narratives such as “90 percent of the world’s stocks are fully or overfished” often overlook important regional variations and thus may be overly pessimistic in depicting global stock status as declining.17
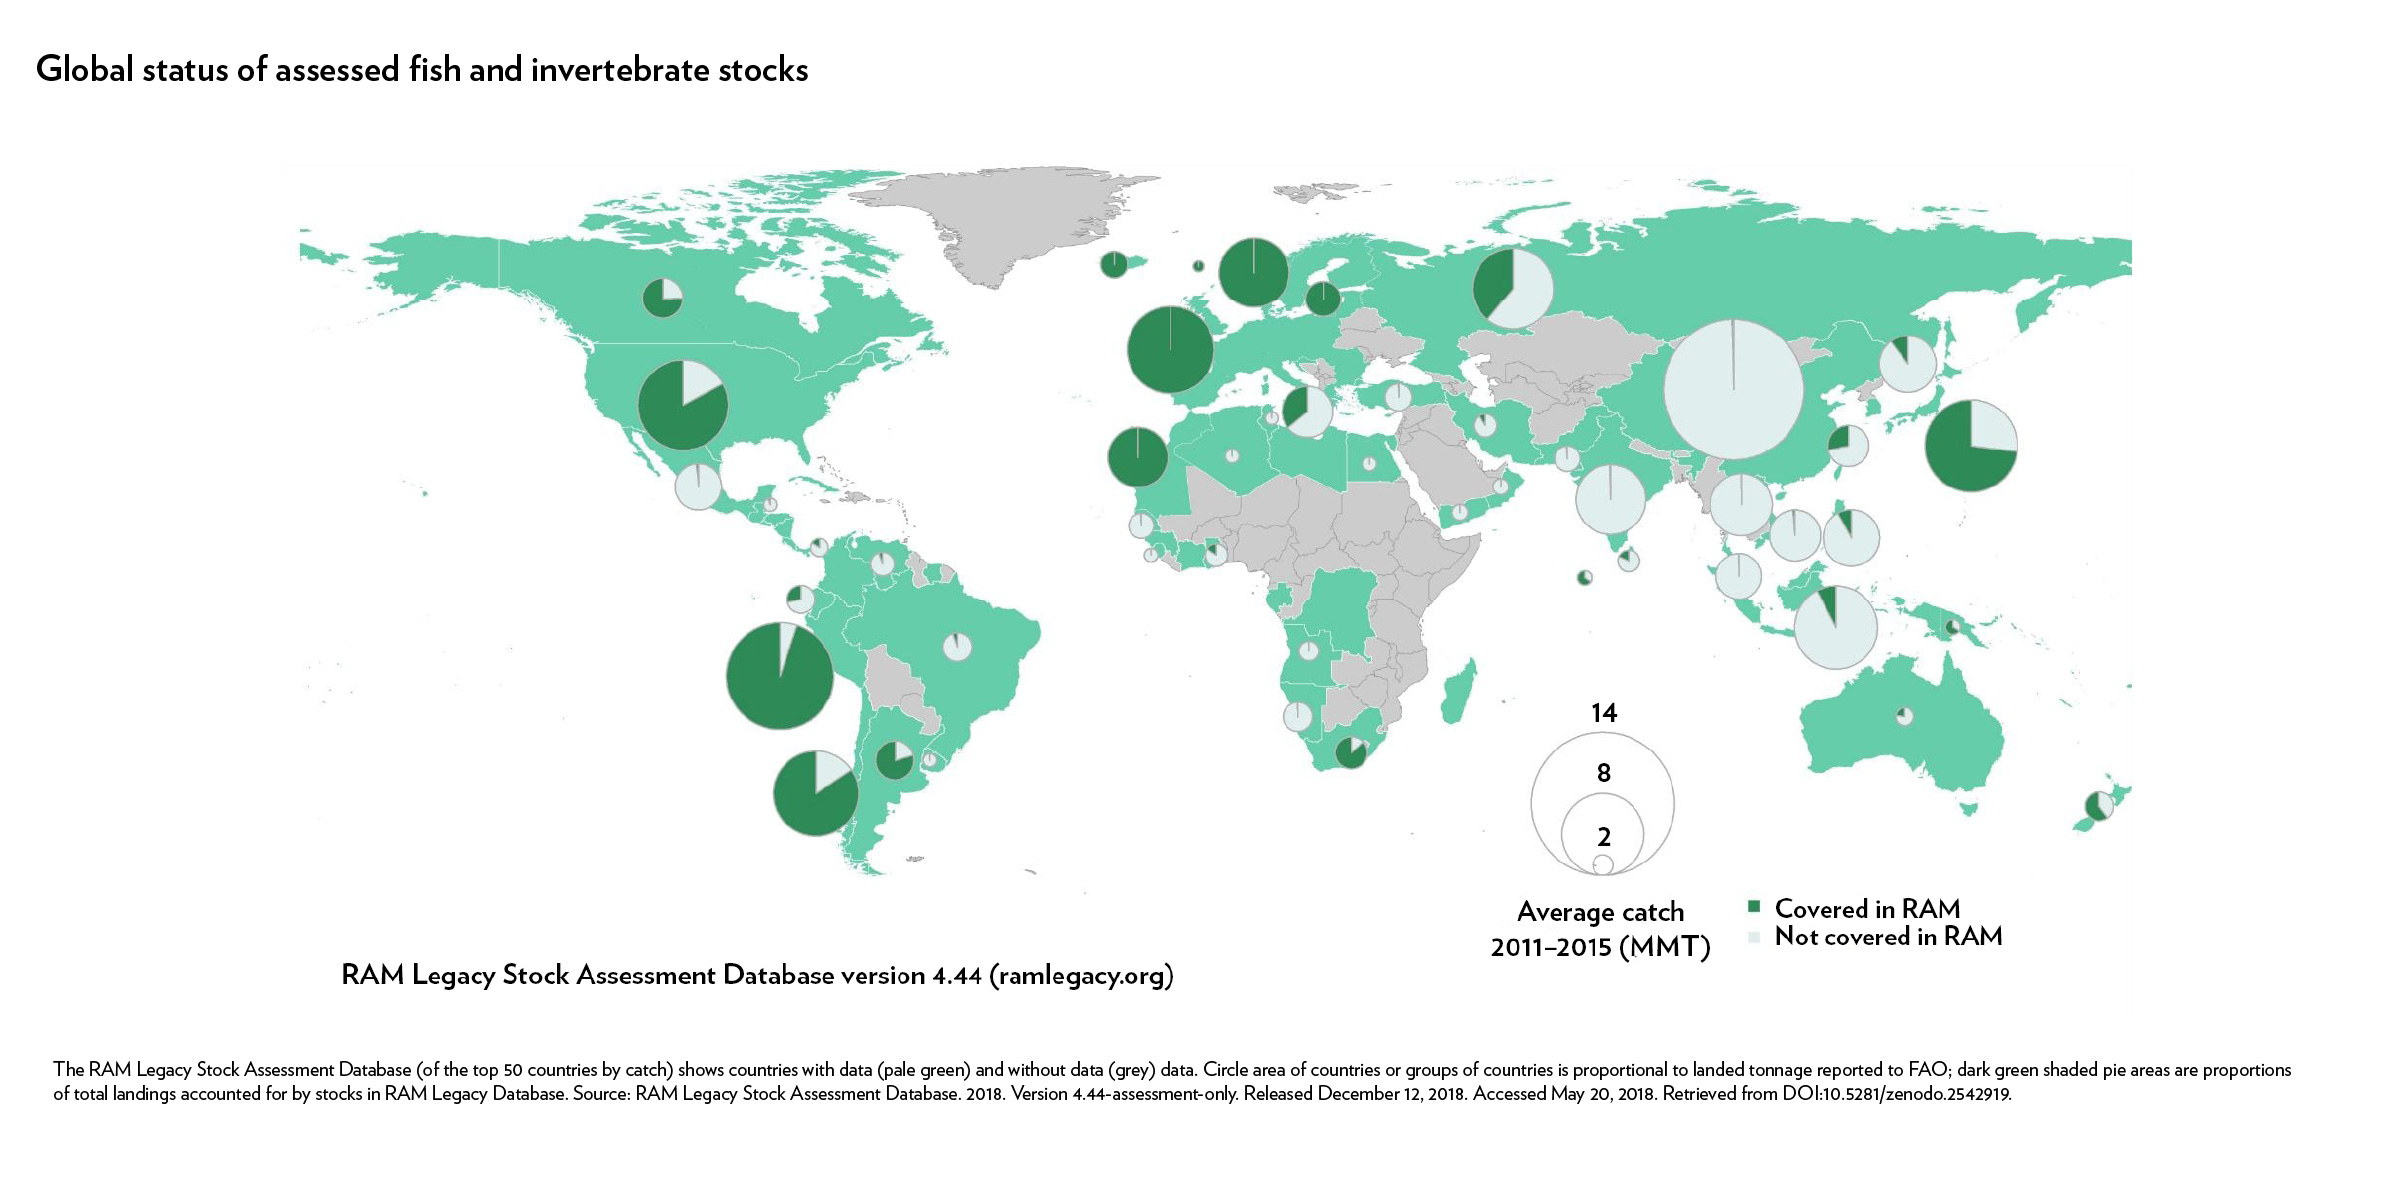
As shown in the RAM Legacy Database, stock assessment data are available for roughly half of global marine fish catch (Figure 2.8).18
Global status of assessed fish and invertebrate stocks
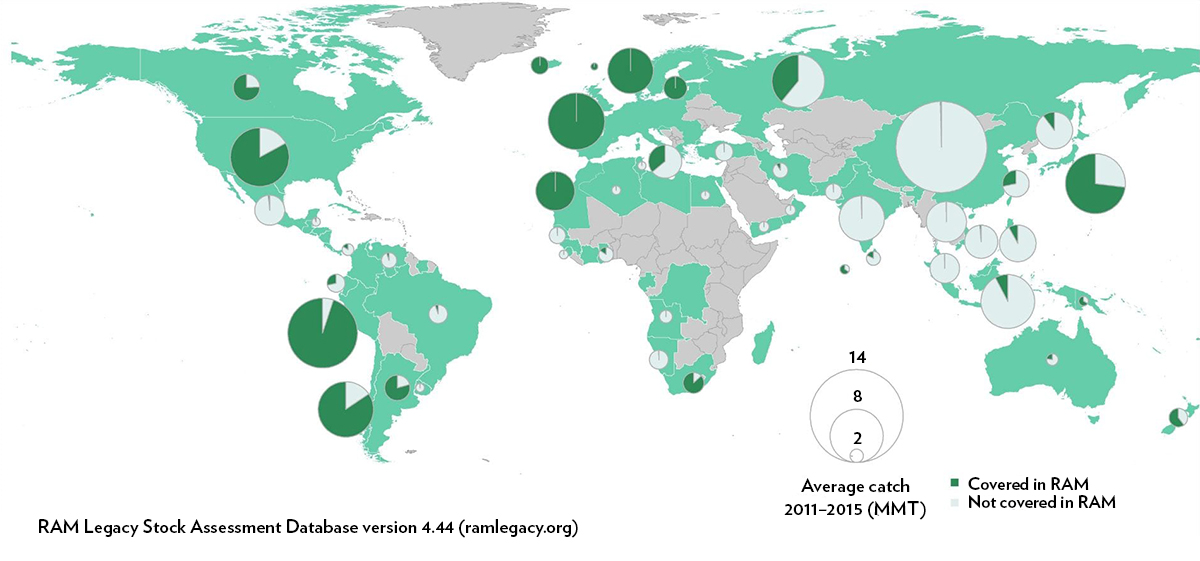
The RAM Legacy Stock Assessment Database (of the top 50 countries by catch) shows countries with data (pale green) and without data (grey) data. Circle area of countries or groups of countries is proportional to landed tonnage reported to FAO; dark green shaded pie areas are proportions of total landings accounted for by stocks in RAM Legacy Database.
Source: RAM Legacy Stock Assessment Database. 2018. Version 4.44-assessment-only. Released December 12, 2018. Accessed May 20, 2018. Retrieved from DOI:10.5281/zenodo.2542919.
For the half of the world’s fish catch for which abundance data are available, there has generally been an uptick in the biomass of fish stocks in recent years.19 In contrast, unassessed stocks are believed to have continued to decline.20 In several countries, reduction in fishing pressure is directly associated with fisheries management policy changes. Examples where fishing pressure has decreased after policy changes include: the Magnuson-Stevens Act in the United States (revised in 1996), Common Fisheries Policy in Atlantic Europe (updated in 2002), and total allowable catches for several species in Japan (introduced in 1996).
Average trends in Mean B/Bmsy for assessed and unassessed stocks
Fisheries Management and Governance
Overfishing is tightly associated with insufficient fisheries management capacity. The Fisheries Management Index (FMI), which relies on expert surveys to rate management effectiveness on a stock-by-stock basis, found substantial variation in management globally. The analysis found that three management attributes related to science-based limits are the largest determining factors of a country’s stock health: effectiveness of stock assessments, strength of fishing pressure limits, and comprehensiveness of enforcement programs.21
The FMI survey was conducted in 2016 and 2018. Over that two-year period, there was relatively little change in the FMI scores of individual countries.22 The FMI scores continue to hold a strong positive correlation with GDP per capita and a negative correlation with capacity-enhancing subsidies.
Fisheries Management Index (2016 and 2018)
According to the second edition of the World Bank’s “Sunken Billions” analysis, the suboptimal management of fisheries carries significant economic losses: as much as USD 83 billion (in 2012 dollars) are lost annually in foregone economic benefits compared to what could be generated through more sustainable management of fisheries.23 The 2017 analysis found that the estimated Sunken Billions were reduced modestly by USD 4 billion (from USD 87 billion between 2004 and 2012).
These economic losses are heavily driven by the overcapitalization of the fishing industry; capacity-enhancing subsidies have been identified as a key driver in facilitating excessive fishing capacity.24 The most recent estimate of global fisheries subsidies (published in 2016) suggests that annual fisheries subsidies were about USD 35 billion (in 2009 dollars).25 This estimate is roughly similar to two previous estimates which used a similar methodology.
For some countries that subsidize their high-seas fishing fleet—including China, Taiwan, and Russia—the government subsidies far exceed fishing profits. This suggests that high-seas fishing, which accounts for 6 percent of global catch, would not be profitable at its current scale for these countries without subsidies.26 Unprofitable fisheries can be propped up by underreporting high-seas catch and by using unfair labor compensation (or no compensation), both of which contribute to IUU.27
Net economic benefits of high-seas fishing
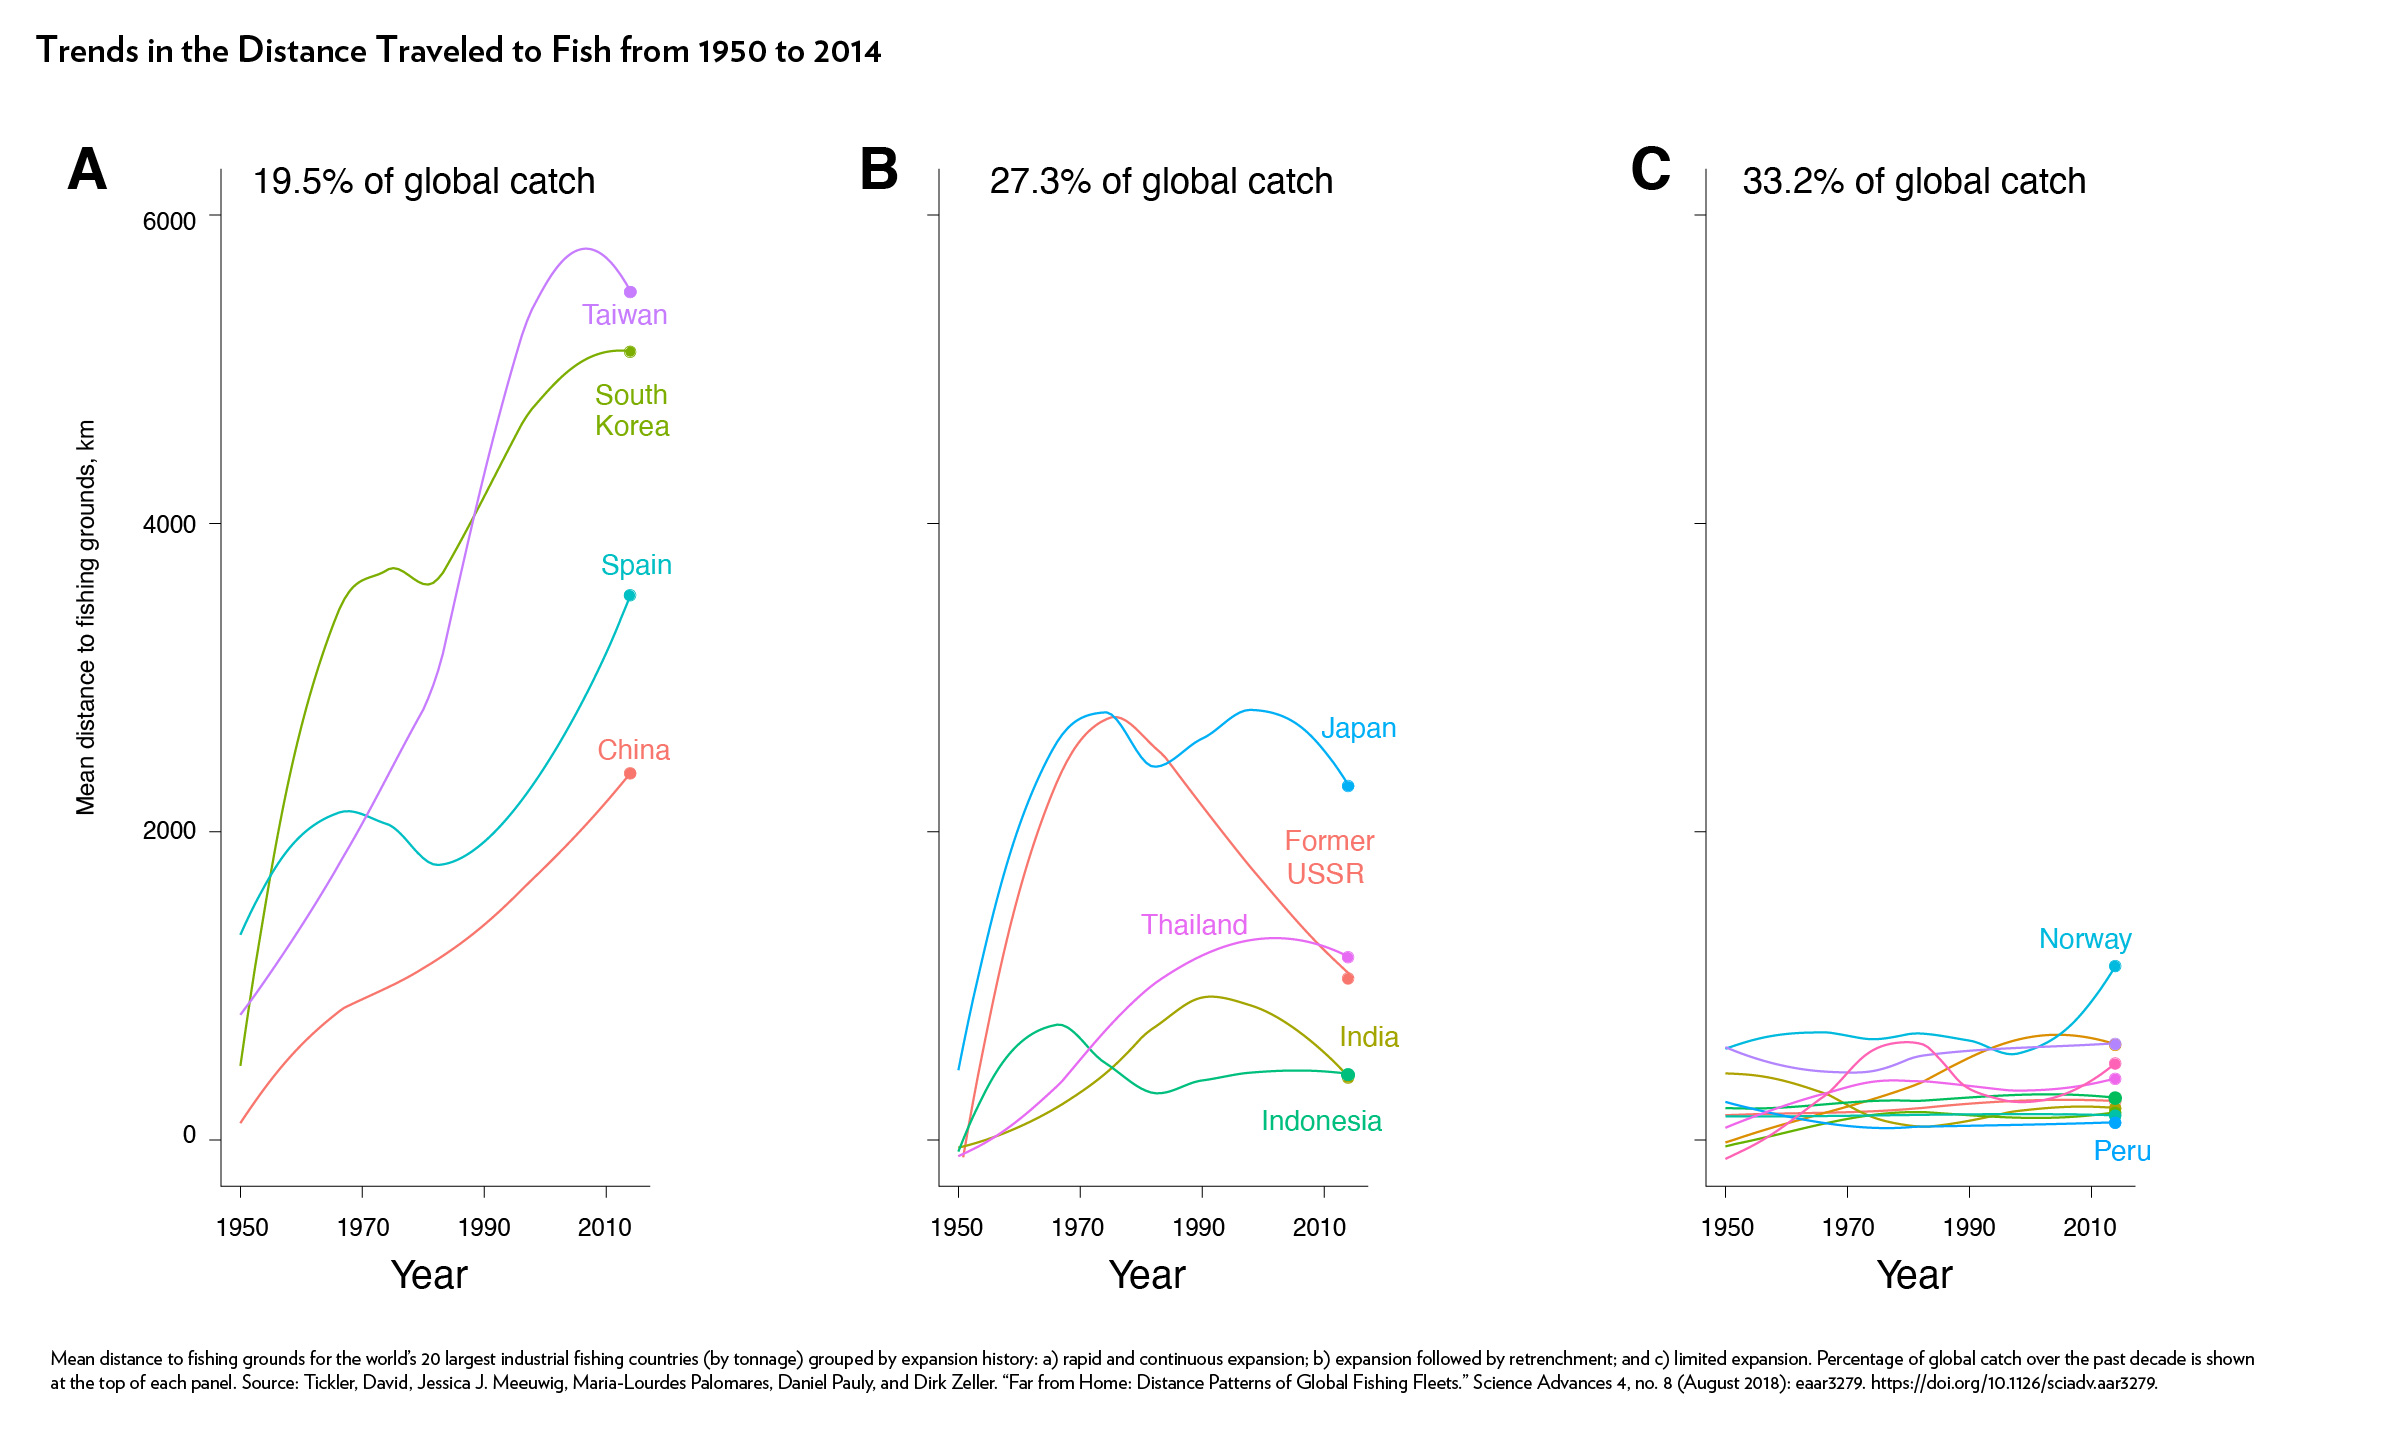
The practice of distant-water fishing, defined as fishing in areas far removed from a country’s domestic waters, has been dominated by a small number of countries in recent decades, particularly Taiwan, South Korea, Spain, and China. These countries have continuously expanded the mean distance to fishing grounds by more than 2000 km between 1950 to 2014.28 Among the top 20 fishing countries of the world, catches from the high seas and EEZs of other countries increased by more than 600 percent from 1950 to 2014—a trend which illustrates the prevalence of distant-water fishing among countries that supply most of the world’s wild-caught seafood.29
Trends in the distance traveled to fish (1950 to 2014)
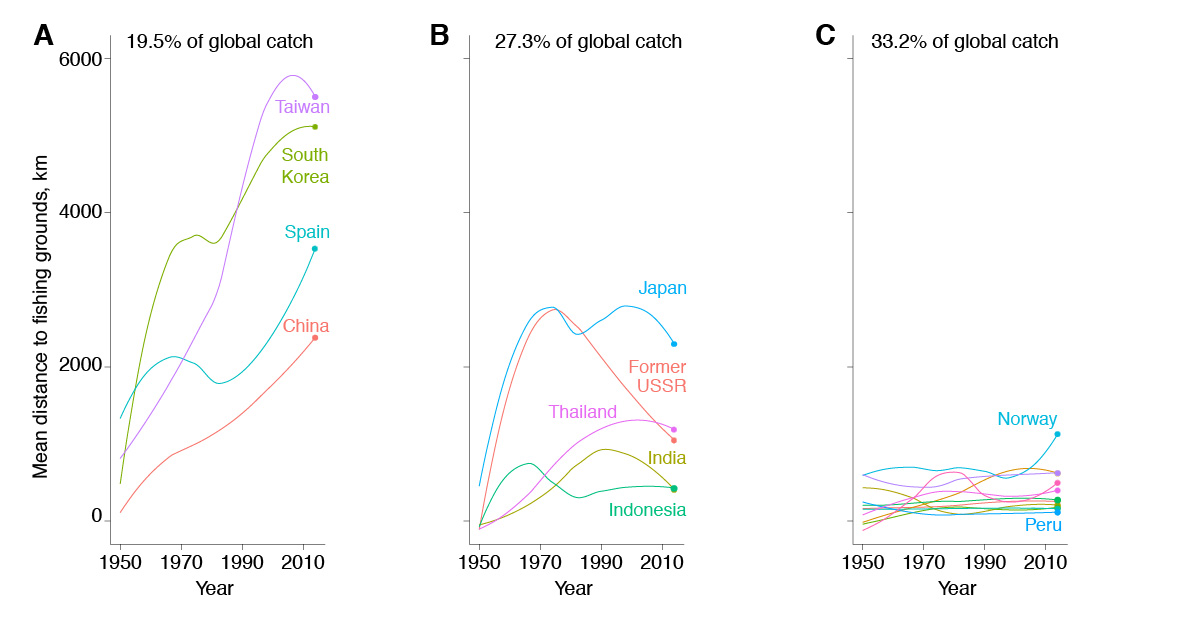
Mean distance to fishing grounds for the world’s 20 largest industrial fishing countries (by tonnage) grouped by expansion history: a) rapid and continuous expansion; b) expansion followed by retrenchment; and c) limited expansion. Percentage of global catch over the past decade is shown at the top of each panel.
Source: Tickler, David, Jessica J. Meeuwig, Maria-Lourdes Palomares, Daniel Pauly, and Dirk Zeller. “Far from Home: Distance Patterns of Global Fishing Fleets.” Science Advances 4, no. 8 (August 2018): eaar3279. https://doi.org/10.1126/sciadv.aar3279.
One of the responses to overfishing has been an array of market-driven efforts to promote sustainability. In the past decade, corporate sustainable seafood has become mainstream as commitments by retailers, food service companies, and supply chains have driven market-based conservation interventions in the fisheries sector. Certification and fishery improvement projects are now underway in over 600 fisheries, representing nearly 25 percent of wild-caught seafood globally. By species group, tuna, whitefish, salmon and shellfish are the most engaged commodities.30
Between 2012 and 2016, the number of FIPs and MSC-certified fisheries has grown steadily, while the certified share of global landings dipped slightly from 25 percent in 2012 to 23 percent in 2015.31 Additional details on producer progress can be found at Fishery Progress and the MSC annual report.
Total landings by percent volume in FIPs and the MSC program (2012 to 2016)
Certifications and ratings programs have a shared goal of encouraging fisheries to pursue continuous improvement toward environmental sustainability, social responsibility, and economic vitality. Additional information on the complementary role of certifications and ratings programs can be found here. The Monterey Bay Aquarium’s Seafood Watch ratings and eco-certifications have now been applied to about 20 percent of the total wild fisheries production. Among wild capture production and in 2016, Seafood Watch rated one percent of production as “Best Choice,” three percent as “Good Alternative,” and five percent as “Avoid.”32
Seafood Watch Ratings and eco-certifications for wild fisheries production (2016)
The global supply of seafood supplies nearly 20 percent of the average per capita animal protein intake for more than 3.1 billion people.33 At a per capita level, food fish consumption has increased from 9.0 kg in 1961 to an all-time high of 20.2 kg in 2015.34 Fish consumption is growing fastest in developing countries, a trend projected to continue at least through 2022.35
The populations of some countries—including Maldives, Cambodia, Sierra Leone, Kiribati, Solomon Islands, Sri Lanka, Bangladesh, Indonesia, and Ghana—derive more than half of their animal protein from fish.36 While country-level statistics point to the overall contribution of seafood to a country’s food supply, these statistics can obscure important sub-national differences. The level of seafood dependence may also be underestimated for some communities given that official statistics tend to underreport subsistence fishing and informal trade. The global development community is increasingly highlighting the role that capture fisheries and aquaculture can play in contributing to food security and nutrition, in support of the 2030 Agenda for Sustainable Development. While the body of research on these linkages is growing, quantitative information on the connection between seafood supplies and food security is generally lacking.
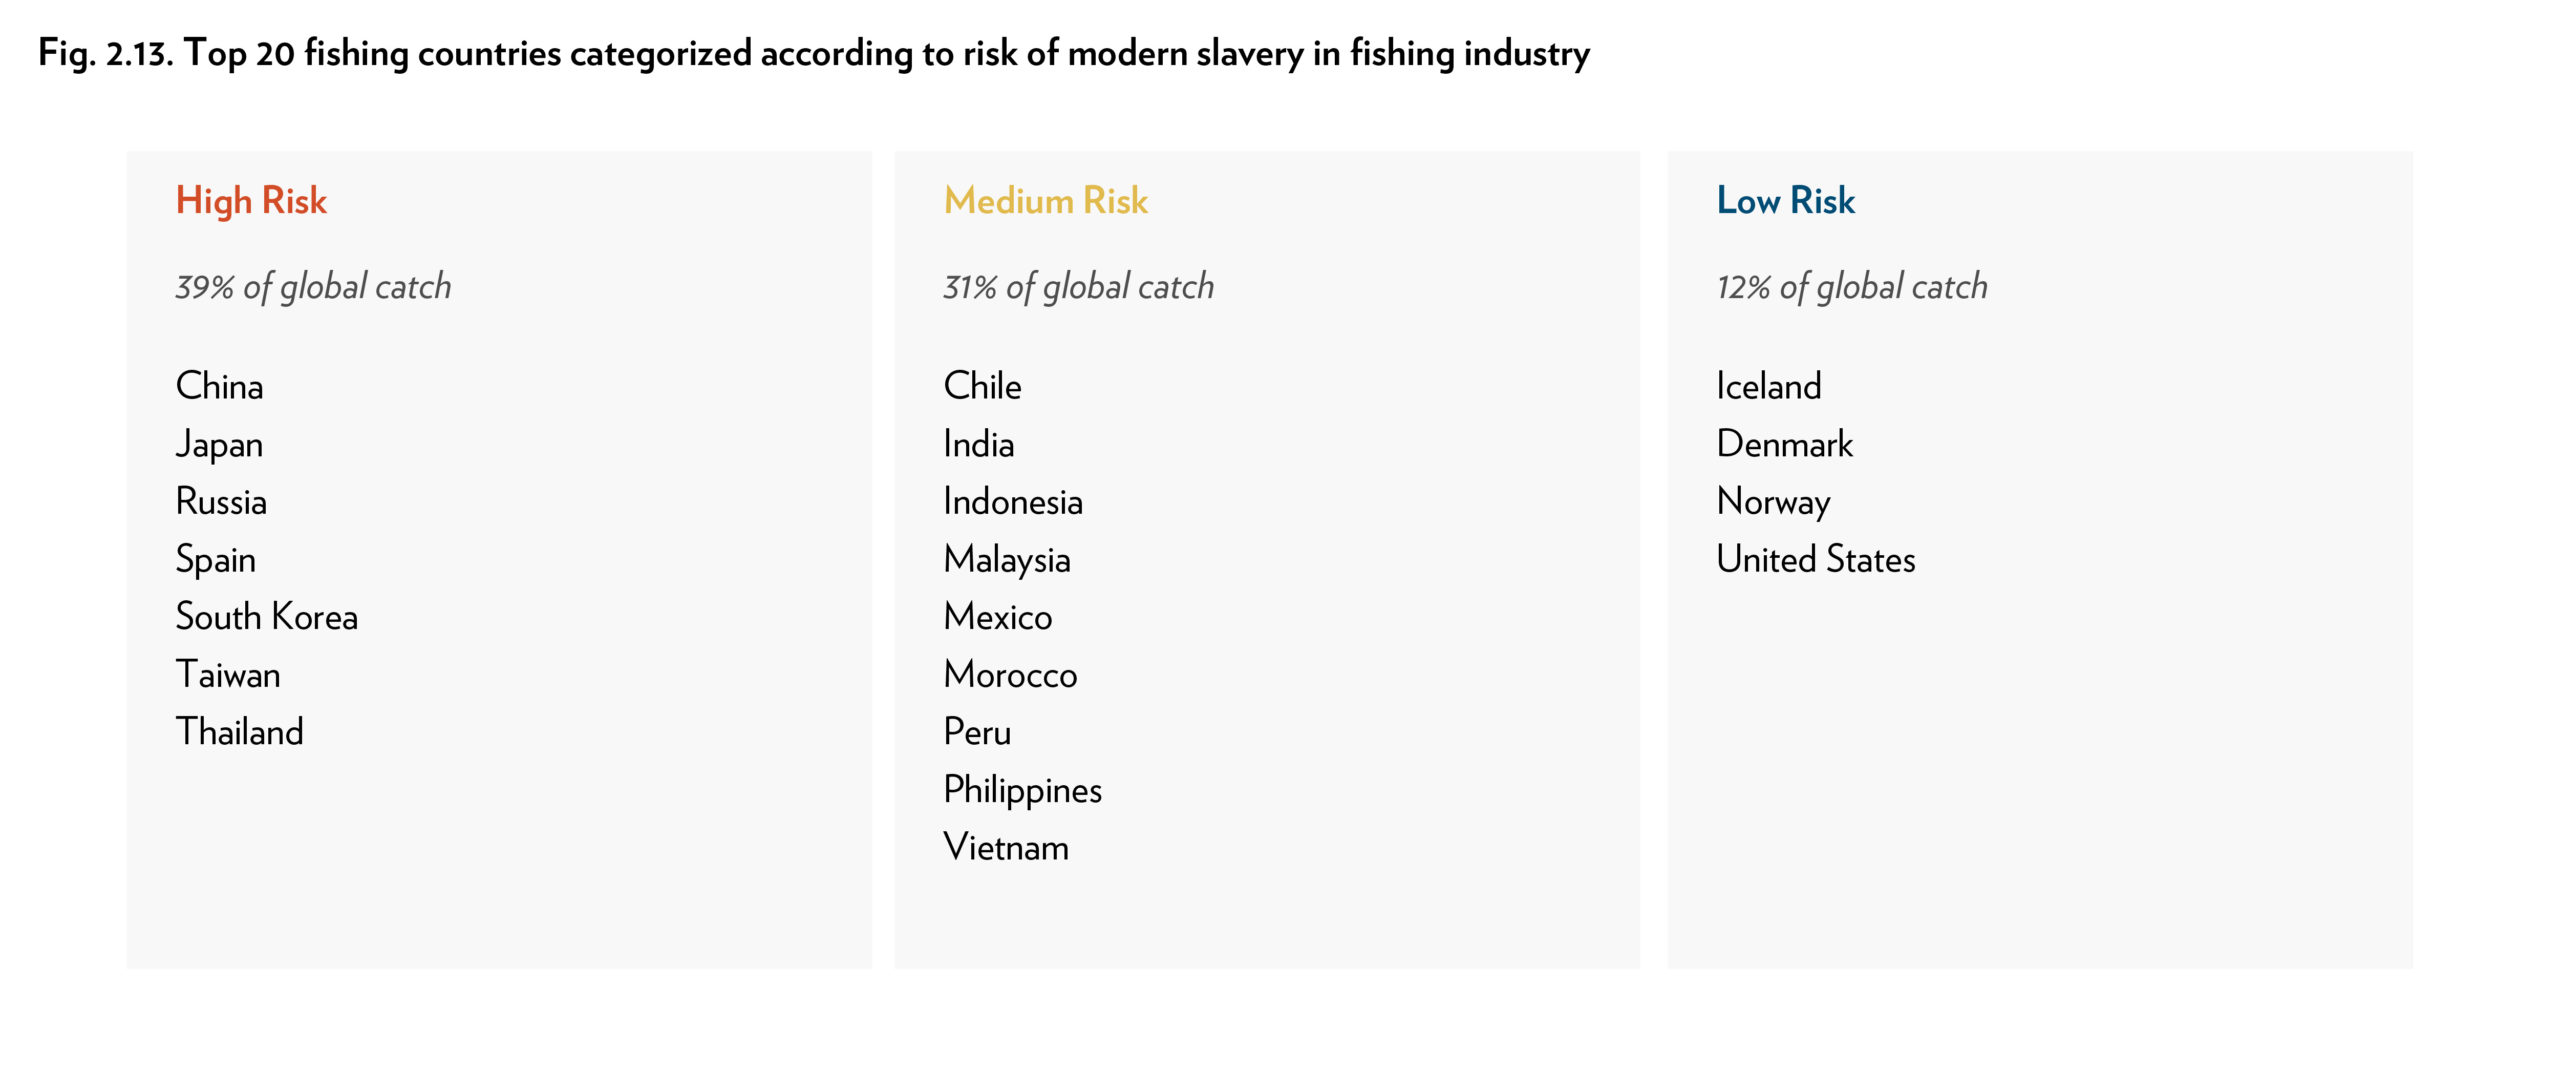
Quantifying the prevalence of modern slavery in fisheries at a global level has been challenging to date; however, a new modeling analysis suggests that modern slavery is at high- to medium-risk of occurring in countries which account for 70 percent of global seafood production.37 The study analyzed data on fisheries management and the level of modern slavery to develop risk factors identifying likely areas of national risk.
The analysis found that modern slavery in major fish-producing countries is driven primarily by a) national fisheries policy (i.e., a country’s management to build and often subsidize distant water fishing fleets, and b) wealth and institutional capacity (i.e., large-scale unreported fishing, limited governance and enforcement capabilities, and low productivity fisheries). Countries which are categorized as “high-risk” of experiencing modern slavery in their fishing industry account for 39 percent of the global seafood supply; countries categorized as “medium risk” provide 31 percent of global seafood supply.
Stakeholders from government, industry, and civil society are increasingly working to collaborate on campaigns to address human rights abuses in the seafood supply chain. One such initiative includes the “SeaChange IGNITE” Initiative, announced at the 2018 Our Ocean Conference. As a partnership between Thai Union, Chicken of the Sea, and Monterey Bay Aquarium, this initiative includes an initial USD 73 million commitment to advance improvements in the seafood supply chain, with a focus on Southeast Asia.38
Top 20 fishing countries categorized according to risk of modern slavery in fishing industry
| High Risk (39% of global catch) |
Medium Risk (31% of global catch) |
Low Risk (12% of global catch) |
|
|
|
Source: Tickler, D, Bryant, K, David, F, Forrest, J A, Gordon, E, Larsen, J J, Meeuwig, J, Oh, B, Pauly, D, Sumaila, U R and Zeller, D. “Common causes, shared solutions: The relationship between modern slavery and the race to fish.” [undergoing review for publication].
Unsustainable Farming
Global Production Trends
As wild capture landings have plateaued since the mid-1990s, aquaculture has driven continued growth in global seafood production. In 2016, aquaculture accounted for 47 percent of total landings, an increase from 26 percent in 2000.39
Share of seafood production by source
The aquaculture sector reached a milestone in 2014 when, for the first time, it provided more fish for human consumption than capture fisheries contributed.40 By 2030, aquaculture is projected to provide 60 percent of fish for human consumption.
Share of food fish for human consumption by source
Total aquaculture production in 2016 was 110 million tons, which included 80 million tons of food fish and shellfish, and 30 million tons of aquatic plants.41 While aquaculture has continued to grow rapidly, the annual growth rate has tapered from the high rates of the 1980s and 1990s (10.8 and 9.5 percent, respectively) as the industry has reached a greater scale.42 During the period 2001 to 2016, global aquaculture’s annual growth rate was 5.8 percent. Still, aquaculture remains the fastest-growing food sector in the world.43
Global aquaculture production as compared to wild capture production
By species group, freshwater fishes (particularly carp) accounted for 48 percent of aquaculture production in 2016. Seaweed represented 27 percent of production, and molluscs another 15 percent. Saltwater fishes accounted for just 9 percent of global production.
Aquaculture production by species group
Steady growth in Asia has continued to spur the continued expansion of the sector. The bulk of growth in aquaculture production has come from China, Southeast Asia, and South Asia. Since 1991, China has produced more farmed food fish annually than the rest of the world combined.44
Aquaculture production in Asia compared to the rest of the world
Not all aquaculture production has the same environmental footprint. A handful of farmed species pose a greater threat to the environment in terms of dependency on feed inputs, freshwater use, disease introduction, biodiversity impacts, and other concerns. These concerns are most concentrated in the production of marine finfish, diadromous fish (e.g., salmon, eel), and crustaceans such as shrimp. These species of concern made up approximately 13 percent of global aquaculture production in 2016.45 This ratio has followed a slight upward trajectory in recent years, up from 11 percent of total production in 2000.
Aquaculture production by species of concern
Species of concern
Aquaculture Species of Concern
- Amberjacks*
- Atlantic salmon
- Ayu sweetfish
- Banana prawn
- Barramundi (Giant seaperch)
- Bastard halibut
- Chinese mitten crab
- Chinook salmon (Spring salmon, King salmon)
- Clearhead icefish
- Cobia
- Coho salmon (Silver salmon)
- Fleshy prawn
- Freshwater prawns, shrimps*
- Giant river prawn
- Giant tiger prawn
- Groupers*
- Indo-Pacific swamp crab
- Jacks, crevalles*
- Japanese amberjack
- Japanese eel
- Japanese jack mackerel
- Japanese seabass
- Kuruma prawn
- Large yellow croaker
- Lefteye flounders*
- Longfin yellowtail
- Marine crabs*
- Marine Fishes*
- Metapenaeus shrimps*
- Milkfish
- Mullets*
- Obscure pufferfish
- Oriental river prawn
- Pacific bluefin tuna
- Penaeus shrimps*
- Pond smelt
- Porgies, seabreams*
- Portunus swimcrabs*
- Rainbow trout
- Red drum
- Righteye flounders*
- River eels*
- River prawns*
- Salmonoids*
- Silver seabream
- Snubnose pompano
- Sturgeons*
- Tiger pufferfish
- Tropical spiny lobsters*
- Trouts*
- Turbot
- White trevally
- Whiteleg shrimp
- Yellowfin tuna
Aquaculture Species Groups Not of Concern
- Brown seaweeds
- Red seaweeds
- Green seaweeds
- Mussels
- Pearls, mother-of-pearl, shells
- Sea-squirts and other tunicates
- Scallops, pectens
- Oysters
* not elsewhere identified
From a trade perspective, shrimp, tilapia, salmon, and pangasius are the most internationally traded aquaculture species. The share of aquaculture exported to Western markets is relatively small, as many countries (particularly China) retain a large share of aquaculture products for internal consumption. The portion of aquaculture which is traded to international markets tends to consist of high-value species.
Global aquaculture production, by geography and top species of production
Environmental Challenges
While the rapid growth of aquaculture has contributed to income generation and food security, it has also led to several discrete environmental impacts. The overarching challenge for the sector is to sustain growth while reducing environmental impacts—which range from habitat conversion and water pollution to disease outbreaks and dependency on wild fisheries as feed. Authoritative data on the trendline of impacts from global aquaculture production are generally lacking, particularly for water quality. Even so, aquaculture has been identified as a driving factor in appropriating coastal habitat, particularly in Southeast Asia which has more than one-third of the world’s mangrove forest extent.46
During the rapid expansion period of tropical coastal aquaculture between 1980 to 1990, aquaculture accounted for roughly 54 percent of all mangrove deforestation in Southeast Asia.47 A recent analysis found that the conversion of mangrove habitat to fish or shrimp ponds has followed a decreasing trendline: between 2000 and 2012, aquaculture accounted for about 30 percent of mangrove conversion in Southeast Asia. Beyond aquaculture, the rapid expansion of rice agriculture (particularly in Myanmar) and the conversion of mangroves to palm oil plantations (especially in Malaysia and Indonesia) have also driven mangrove deforestation in the region.
Temporal trends in the conversion of mangrove habitats to aquaculture in Southeast Asia between 2000 and 2012
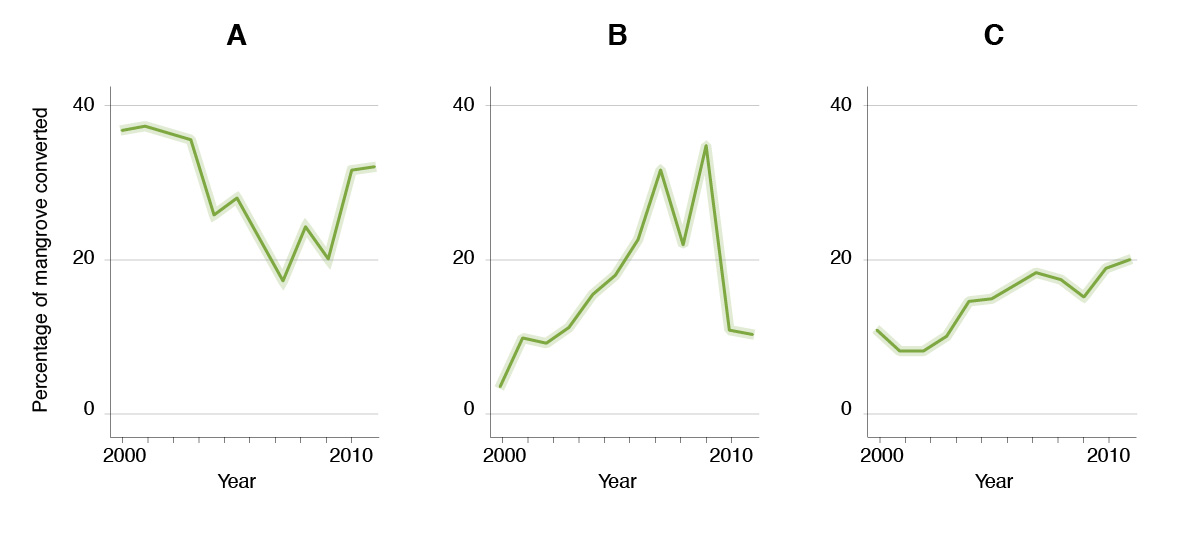
Temporal trends in the conversion of mangrove habitats to aquaculture (A), rice agriculture (B), and oil palm plantation (C), between 2000 and 2012. Dark green lines indicate error-corrected estimates of the proportional coverage of each land use. Light green shading indicates the standard error of the areal estimates.
Adapted from: Richards, Daniel R., and Daniel A. Friess. “Rates and Drivers of Mangrove Deforestation in Southeast Asia, 2000–2012.” Proceedings of the National Academy of Sciences 113, no. 2 (January 12, 2016): 344–49. https://doi.org/10.1073/pnas.1510272113.
Another environmental concern unique to aquaculture is the sector’s heavy dependence on wild fisheries for fishmeal and fish oil. There is not definitive evidence indicating whether aquaculture is driving pressure on wild fisheries. However, inclusion rates of fishmeal and fish oil in aquafeeds have been declining steadily over the last few decades, partly due to the limited supply of raw materials.48 Global fishmeal production peaked in 1994 at 30 million tons (live weight equivalent).49 Since then, it has followed a fluctuating but overall declining trend.50 In 2016, wild capture landings directed to fishmeal production had decreased to less than 15 million tons. Currently, by-products from fish processing account for approximately 25 to 35 percent of the total volume of fishmeal and fish oil produced; this proportion is expected to increase in future years.
Total global production of fishmeal and main meal consuming species
Market Initiatives
Although considerable work remains, stakeholders have made notable progress in addressing sustainability concerns in the aquaculture sector in recent years. Just as certifications and ratings have grown steadily in the wild capture sector, the aquaculture sector has experienced even more rapid growth in product under responsible sourcing. Certifications and ratings programs have a shared goal of encouraging aquaculture to pursue continuous improvement toward environmental sustainability, social responsibility, and economic vitality. Additional information on the complementary role of certifications and ratings programs can be found here.
The Monterey Bay Aquarium’s Seafood Watch ratings and eco-certifications have now been applied to about 45% of total aquaculture production. Among aquaculture production in 2016, Seafood Watch rated 33% of production as “Best Choice,” 1% as “Good Alternative,” and 8% as “Avoid.”
Seafood Watch Ratings and eco-certifications for aquaculture production (2016)
Between 2014 and 2017, ASC certifications quadrupled while GAA certifications doubled. The three countries that account for the highest certified ASC volume are Norway (primarily salmon), Vietnam (primarily pangasius), and Chile (a combination of salmon and molluscs).
Certified volume by Aquaculture Stewardship Council (top 20 countries)
The three countries with the highest representation of certified volume by GAA are Chile (primarily salmon), Canada (mainly salmon), and China (principally tilapia).
Certified volume by Global Aquaculture Alliance (top 20 countries)
Notes
- FAO Fisheries and Aquaculture Department, FishStatJ — Software for Fishery Statistical Time Series, updated July 21, 2016.
- Pauly D. and Zeller D., editors. Sea Around Us Concepts, Design and Data, www.seaaroundus.org, 2015.
- Watson, Reg A., and A. Tidd. “Mapping Nearly a Century and a Half of Global Marine Fishing: 1869–2015.” Marine Policy 93 (July 2018): 171–77. https://doi.org/10.1016/j.marpol.2018.04.023.
- Pauly D. and Zeller D., editors. Sea Around Us Concepts, Design and Data.
- J.D. Bell, R.A. Watson, Y. Ye. “Global fishing capacity and fishing effort from 1950–2012.” Fish and Fisheries. 18 (3) (2017) 489–505.
- Agnew, David J, John Pearce, Ganapathiraju Pramod, Tom Peatman, Reg Watson, and Tony J Pitcher. “Estimating the Worldwide Extent of Illegal Fishing.” PLoS ONE 4, no. 2 (2009): 8.
- Watson, Reg A., and A. Tidd. “Mapping Nearly a Century and a Half of Global Marine Fishing: 1869–2015.”
- FAO, FishStatJ — Software for Fishery Statistical Time Series.
- Ibid.
- Ibid.
- Cao, Ling, Yong Chen, Shuanglin Dong, Arthur Hanson, Bo Huang, Duncan Leadbitter, David C. Little, et al. “Opportunity for Marine Fisheries Reform in China.” Proceedings of the National Academy of Sciences 114, no. 3 (January 17, 2017): 435–42.
- FAO, ed. The State of World Fisheries and Aquaculture 2018. Rome, 2018.
- Ibid.
- Pauly D. and Zeller D., eds. Sea Around Us Concepts, Design and Data.
- Rosenberg et al. “Applying a New Ensemble Approach to Estimating Stock Status of Marine Fisheries around the World.” Conservation Letters, January/February 2018, 11(1), 1–9. https://doi.org/10.1111/conl.12363.
- Melnychuk, Michael C., Emily Peterson, Matthew Elliott, and Ray Hilborn. “Fisheries Management Impacts on Target Species Status.” Proceedings of the National Academy of Sciences 114, no. 1 (January 3, 2017): 178–83. https://doi.org/10.1073/pnas.1609915114.
- FAO. “The State of World Fisheries and Aquaculture 2016. Contributing to food security and nutrition for all.” Rome: 2016.
- RAM Legacy Stock Assessment Database. 2018. Version 4.44-assessment-only. Released December 12, 2018. Accessed May 20, 2018. Retrieved from DOI:10.5281/zenodo.2542919.
- RAM Legacy Stock Assessment Database. 2018.
- Costello, Christopher et al., “Global Fishery Prospects Under Contrasting Management Regimes.” Proceedings of the National Academy of Sciences 113, no. 18 (2016): 5125-29, https://doi.org/10.1073/pnas.1520420113.
- Melnychuk, Michael C., Emily Peterson, Matthew Elliott, and Ray Hilborn. “Fisheries Management Impacts on Target Species Status.” Proceedings of the National Academy of Sciences 114, no. 1 (January 3, 2017): 178–83. https://doi.org/10.1073/pnas.1609915114.
- Melnychuk, M., C. Ashbrook, M. Pons, R. Hilborn. “Assessing the effectiveness and recent changes in fisheries management systems of 28 fishing nations with the Fisheries Management Index survey.” University of Washington. August 27, 2018.
- World Bank. “The Sunken Billions Revisited: Progress and Challenges in Global Marine Fisheries.” Washington, DC: World Bank. Environment and Sustainable Development series, 2017. doi:10.1596/978-1-4648-0919-4.
- Sumaila, U. Rashid, Vicky Lam, Frédéric Le Manach, Wilf Swartz, and Daniel Pauly. “Global Fisheries Subsidies: An Updated Estimate.” Marine Policy 69 (July 2016): 189–93. https://doi.org/10.1016/j.marpol.2015.12.026.
- Ibid.
- Sala, Enric, Juan Mayorga, Christopher Costello, David Kroodsma, Maria L. D. Palomares, Daniel Pauly, U. Rashid Sumaila, and Dirk Zeller. “The Economics of Fishing the High Seas.” Science Advances 4, no. 6 (June 2018): eaat2504. https://doi.org/10.1126/sciadv.aat2504.
- Ibid.
- Tickler, David, Jessica J. Meeuwig, Maria-Lourdes Palomares, Daniel Pauly, and Dirk Zeller. “Far from Home: Distance Patterns of Global Fishing Fleets.” Science Advances 4, no. 8 (August 2018): eaar3279. https://doi.org/10.1126/sciadv.aar3279.
- Ibid.
- CEA Consulting, “Progress toward sustainable seafood — by the numbers.” Prepared for the David and Lucile Packard Foundation, 2017.
- Ibid.
- Monterey Bay Aquarium Seafood Watch, Seafood Watch Ratings, data provided to CEA on November 2, 2018.
- FAO, ed. The State of World Fisheries and Aquaculture 2018.
- Ibid.
- CEA Consulting, “Progress toward sustainable seafood — by the numbers.”
- Bennett, Abigail, Pawan Patil, Kristin Kleisner, Doug Rader, John Virdin, and Xavier Basurto, “Contribution of Fisheries to Food and Nutrition Security: Current Knowledge, Policy, and Research,” 2018, NI Report 18–02, Durham, NC: Duke University.
- Tickler, D, Bryant, K, David, F, Forrest, J A, Gordon, E, Larsen, J J, Meeuwig, J, Oh, B, Pauly, D, Sumaila, U R and Zeller, D. “Common causes, shared solutions: The relationship between modern slavery and the race to fish.” [undergoing review for publication].
- Chase, Chris. “Thai Union, Chicken of the Sea, and Monterey Bay Aquarium announce sustainability collaboration,” Seafood Source, October 30, 2018, https://www.seafoodsource.com/news/environment-sustainability/thai-union-chicken-of-the-sea-and-monterey-bay-aquarium-announce-sustainability-collaboration. (Accessed November 8, 2018)
- FAO, ed., The State of World Fisheries and Aquaculture 2018., Rome, 2018.
- FAO, ed., The State of World Fisheries and Aquaculture 2016., Rome, 2016.
- Ibid.
- Ibid.
- Halley Froehlich and Rebecca Gentry. “Aquaculture, the Fastest-growing Food Sector in the World, Still Has a Long Way To Go.” Project Earth. https://projectearth.us/aquaculture-the-fastest-growing-food-sector-in-the-wor-1800675704. October 19, 2017.
- Ibid.
- FAO, ed., The State of World Fisheries and Aquaculture 2018., Rome, 2018.
- Richards, Daniel R., and Daniel A. Friess. “Rates and Drivers of Mangrove Deforestation in Southeast Asia, 2000–2012.” Proceedings of the National Academy of Sciences, no. 2 (January 12, 2016): 344–49. https://doi.org/10.1073/pnas.1510272113.
- Ibid.
- World Bank, Fish to 2030: Prospects for Fisheries and Aquaculture, World Bank Report Number 83177-GLB, Dec. 2013.
- FAO, ed., The State of World Fisheries and Aquaculture 2018.
- Ibid.