Ocean-Climate Trends
- CO2 levels:
- 413ppm in 2020
- Marine heatwaves:
- 2x frequency since 1982
- Ocean heat content:
- 2020 was warmest year ever recorded
- Natural disaster costs:
- USD 210B in 2020
- Arctic rate of warming:
- 2x the global average
- Arctic summer sea ice:
- 2020 was 2nd lowest extent
Jump to:
Climate change represents the fastest-growing and most intense threat facing the global ocean.1,2 Impacts of climate change are more pronounced and occurring earlier than scientists predicted even a decade ago.3 The fingerprint of human-induced climate change is perhaps most evident in the ocean. As the Earth’s largest heat sink, the global ocean has warmed at unabated levels since 1970, absorbing more than 90 percent of excess heat energy.4 The rate of ocean warming has more than doubled since 1993.5 On the whole, the ocean is higher, warmer, stormier, more acidic, and has less oxygen due to climate-induced changes.
Below are five notable trends in recent years on the changing climate and how it impacts ocean health.
Carbon dioxide levels today are higher than at any other point in the past 3.6 million years. The concentration of atmospheric CO2 reached a historic high in 2021: it is now at the halfway point to doubling from preindustrial levels—a first in recorded history.
In 2021, the annual average concentration of carbon dioxide (CO2) is likely to exceed 416 parts per million (ppm). Increased emissions have disproportionately impacted the ocean, which captures about 25 percent of anthropogenic CO2 emissions emitted annually and will ultimately store most of that carbon.6
Carbon dioxide concentration
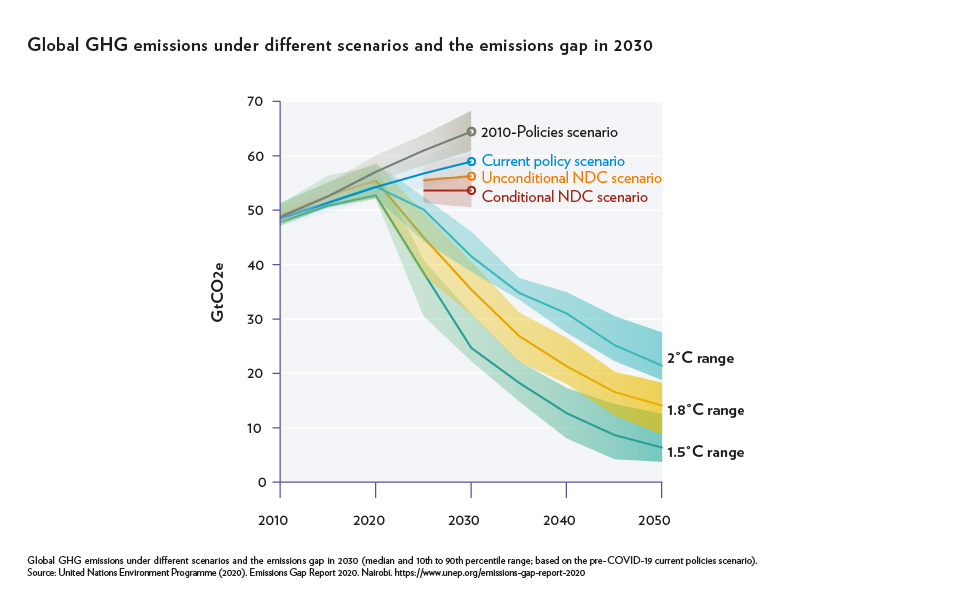
The planet has warmed more than 1 degree Celsius since preindustrial times and is on track to warm in excess of 3 degrees Celsius by 2100.7 This is well beyond Paris Agreement goals of limiting warming to 2 degrees Celsius and pursuing 1.5 degrees Celsius, though experts note that a “green pandemic recovery” from COVID-19 could position the world close to a 2 degree Celsius pathway.
Global GHG emissions under different scenarios and the emissions gap in 2030
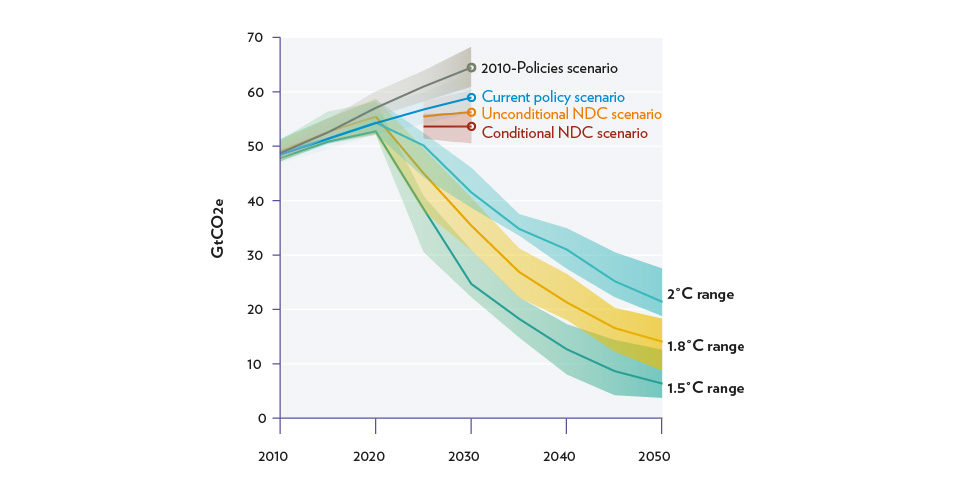
Global GHG emissions under different scenarios and the emissions gap in 2030 (median and 10th to 90th percentile range; based on the pre-COVID-19 current policies scenario). Source: United Nations Environment Programme (2020). Emissions Gap Report 2020. Nairobi. https://www.unep.org/emissions-gap-report-2020
In 2020, global CO2 emissions declined 6.4 percent due to the COVID-19 pandemic.8 However, this temporary dip will not meaningfully advance the world closer to the goals of the Paris Agreement. Emissions already spiked to pre-pandemic levels by April 2021 as global economic activity resumed, meaning this year-on-year reduction in emissions is expected to have a negligible long-term impact on greenhouse gas concentrations.9 In fact, atmospheric CO2 concentrations reached 413 ppm in 2020—which represents a rise of nearly 3 ppm from 2019 and the fifth largest annual increase since direct measurements began.
Carbon dioxide emissions during 2019 and 2020
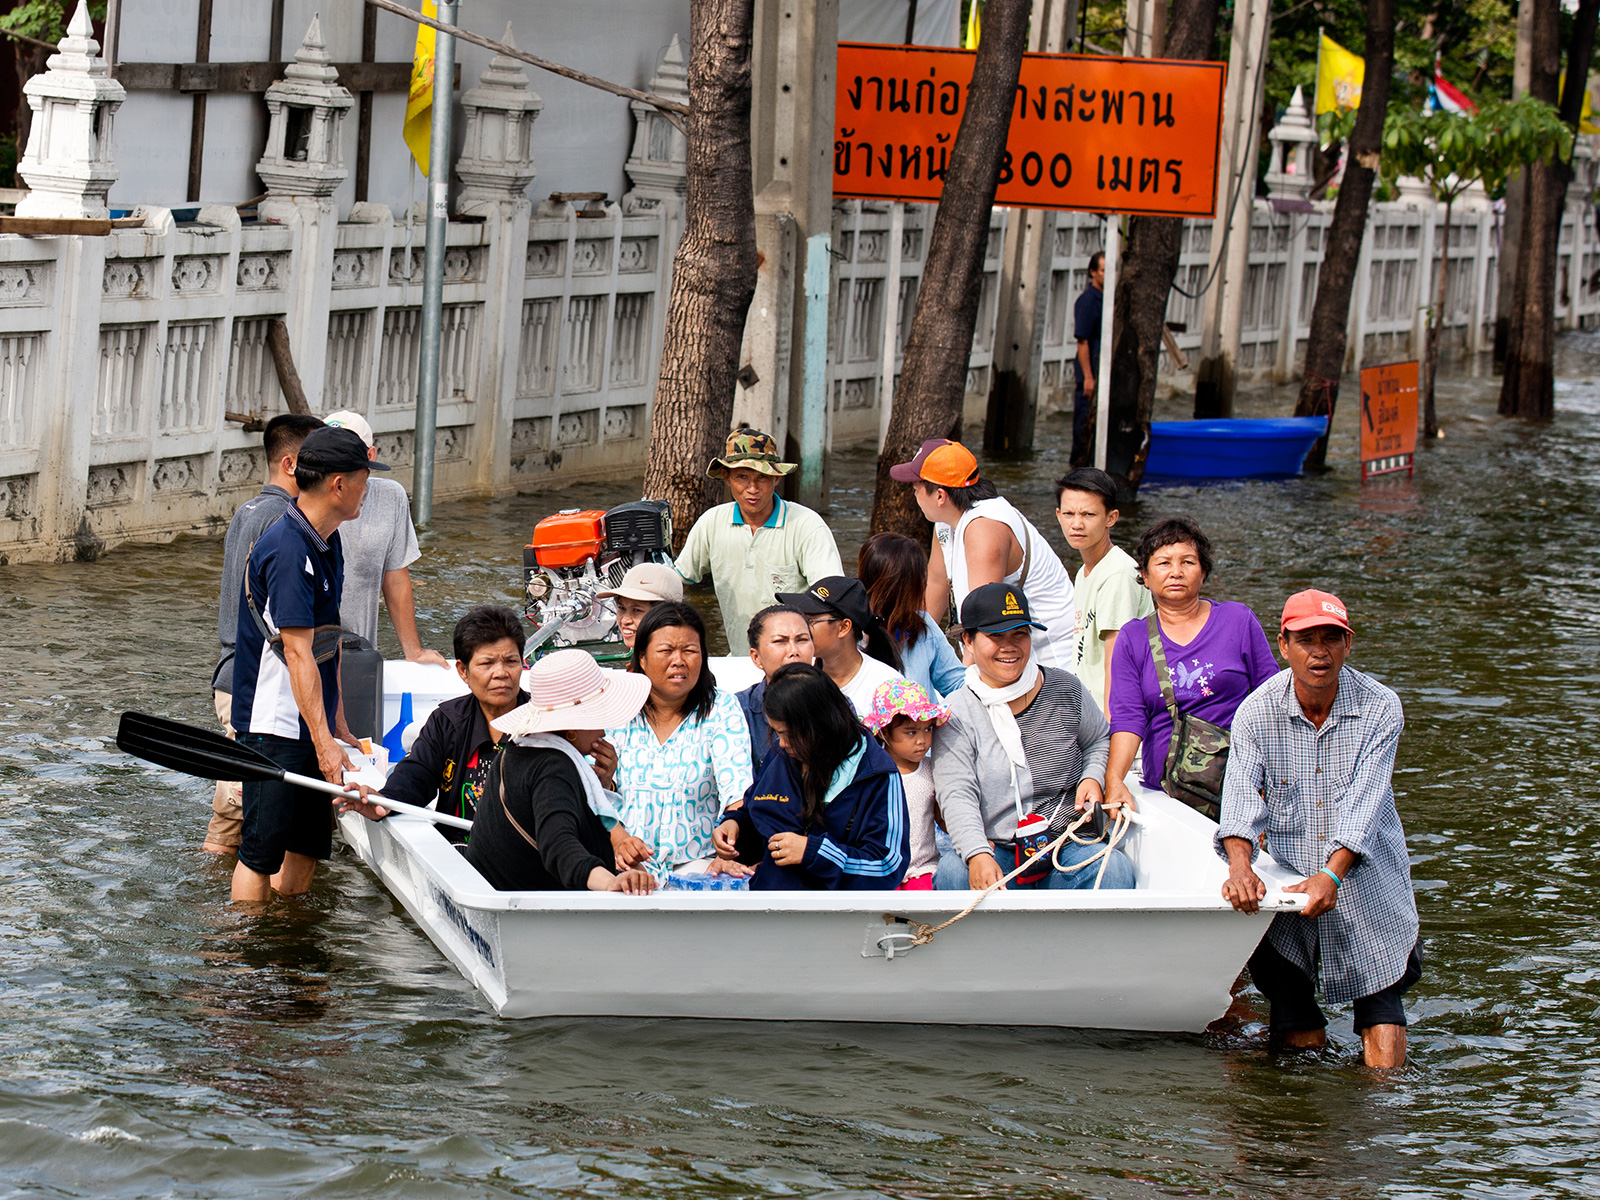
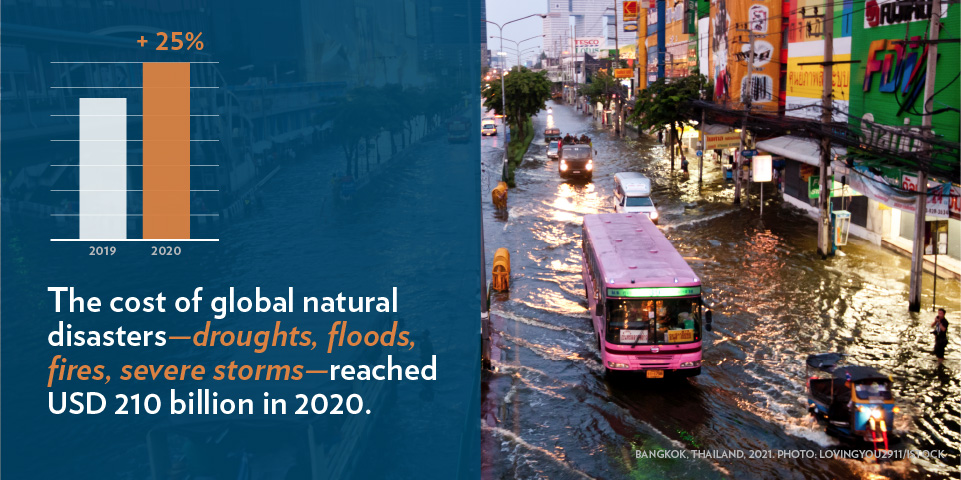
Increased emissions are leading to an increase in natural catastrophes globally, which are threatening lives, assets, and social equity.
A record number of hurricanes, wildfires, and floods exacerbated by climate change cost USD 210 billion worldwide in 2020—a more than 25 percent increase from the previous year—and claimed about 8,200 lives.10 Climate and weather-related extremes have trended steadily upwards, often unfurling the greatest damage on communities that have done the least to cause the climate crisis.
Global number of relevant loss events
In the United States, disaster costs doubled in 2020, reflecting the growing costs of climate change. The USD 95 billion in damages was the third-highest loss since 2010. The six costliest disasters of 2020 globally occurred in the United States.11 The Atlantic hurricane season in 2020 was the most active and the fifth most expensive Atlantic hurricane season ever recorded. The U.S. wildfire season was similarly record-breaking, burning over 10 million acres—an area the size of Maryland and Delaware combined.
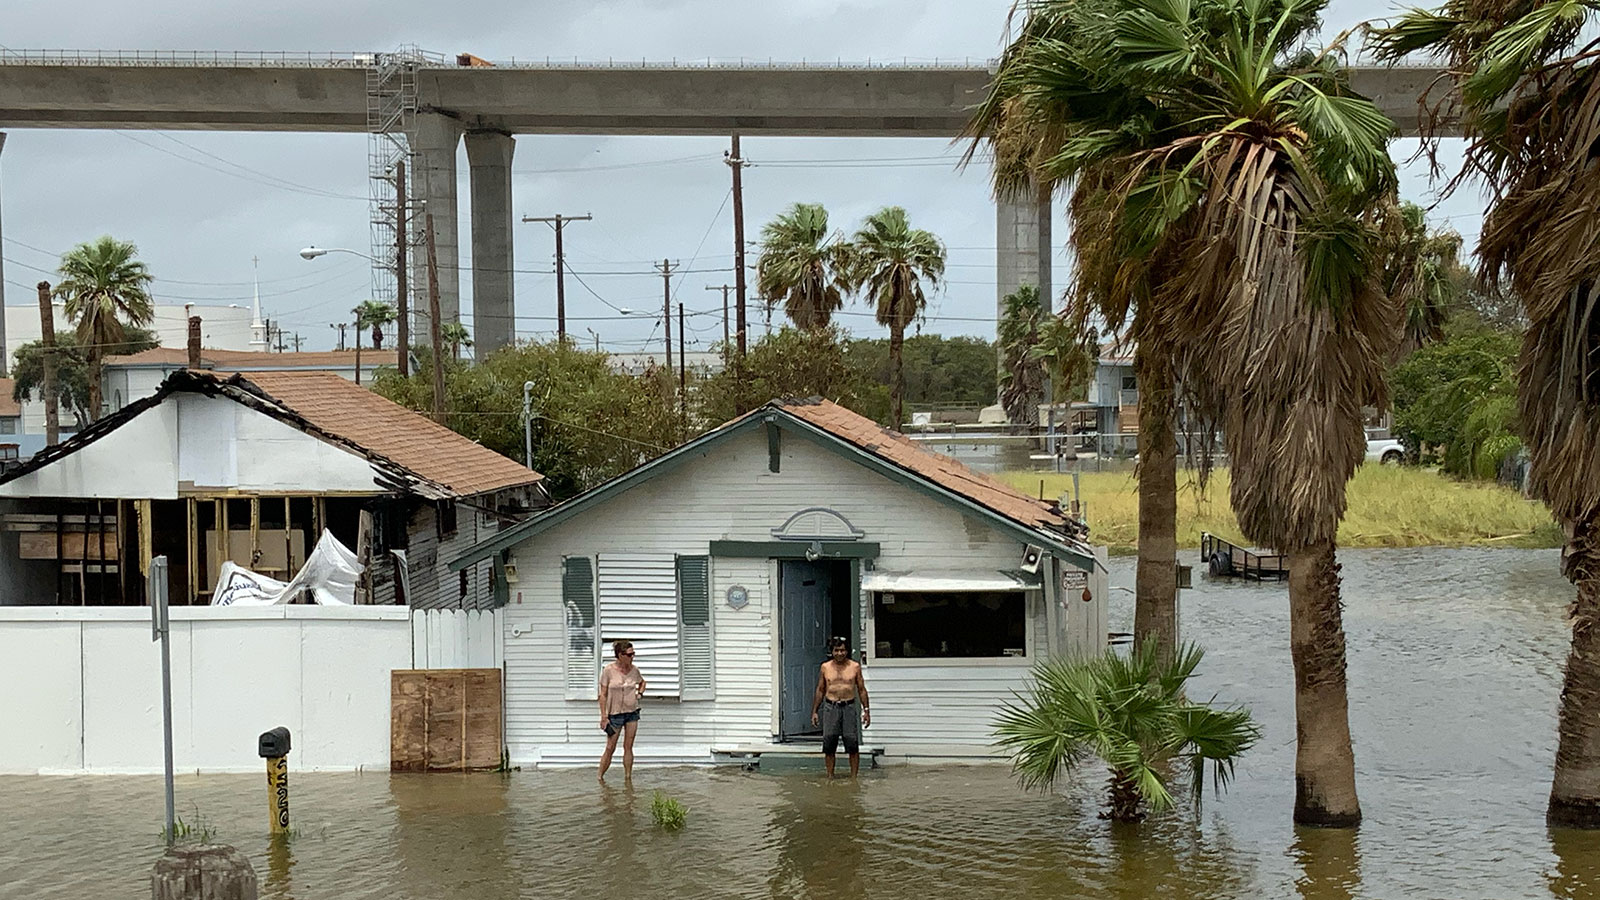
Hurricane Hanna damage, Texas, USA, 2020. Photo: Matt Pierce / iStock
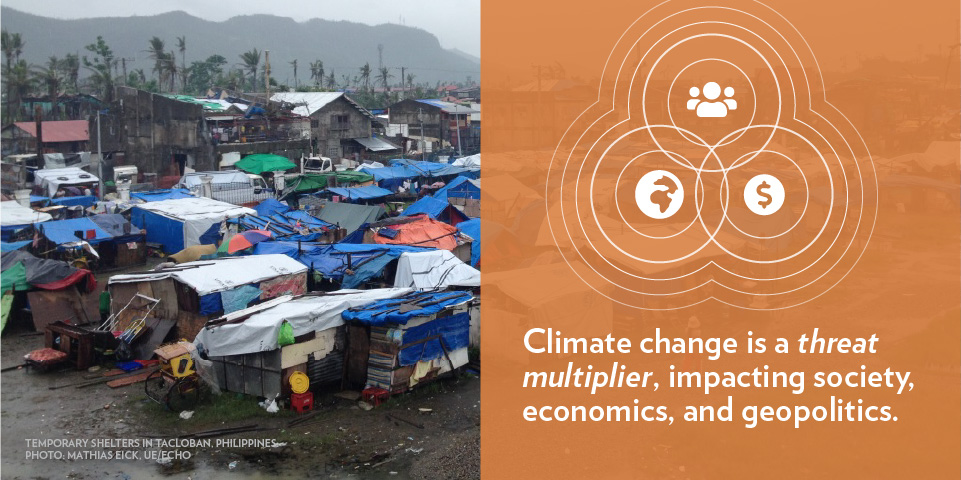
Climate change is a “threat multiplier” as the direct effects of a changing climate exacerbate social and economic disparities and geopolitical tensions. By 2050, climate change could force more than 143 million people across three regions alone—Sub-Saharan Africa, South Asia, and Latin America— to move within their countries.12 The rising trend of natural catastrophes is particularly challenging for communities with less capacity to absorb such shocks and recover equitably. Researchers suggest that climate-fueled disasters are already leading to migration, as seen in the case of Honduras when two Category 4 hurricanes within a two week timespan in 2020 impacted nearly half of the country’s population, leading many impoverished residents to seek economic opportunity in the United States.
Extreme weather events are often seen as more perceptible indicators of a changing climate. However, subtle yet profound changes are taking place in the ocean’s physical properties and chemistry. One of the most marked changes is the increase in ocean heat content, which hit a record high in 2020.
The six hottest years on record for the upper ocean have all occurred since 2015 due to continued increases in greenhouse gas emissions.13 The majority of heat has accumulated in the top 700 meters of the ocean; most of the remainder has accumulated in depths of 700 to 2000 meters. Ocean heat content is considered one of the best indicators of climate change, given that the ocean stores the bulk of excess global warming heat.
Global ocean heat content
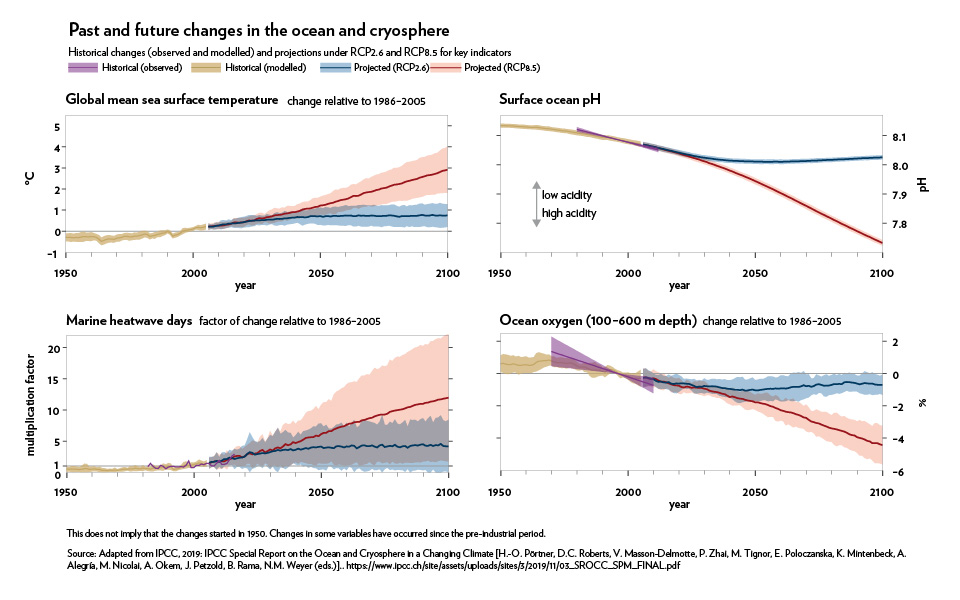
- Climate change is altering sea surface temperature, ocean acidification, and deoxygenation, which are further leading to further changes in ocean circulation and chemistry, sea level rise, increased storm intensity, and shifts in the diversity and abundance of marine species.
- Sea surface temperatures have increased throughout the 20th century and continue to rise. From 1901 through 2015, temperature rose at an average rate of 0.09°C per decade.14
- Science suggests that marine heatwaves have very likely doubled in frequency since 1982 and are increasing in intensity, duration, and physical extent.15
- Since preindustrial times, the pH of the ocean’s surface waters has decreased from 8.21 to 8.10, equating to a roughly 30% increase in acidity.
- Between the middle of the 20th century and 2019, oxygen content of the ocean has declined by around 2 percent and the volume of ocean waters completely depleted of oxygen has quadrupled.16
Past and Future Changes in the Ocean and Cryosphere
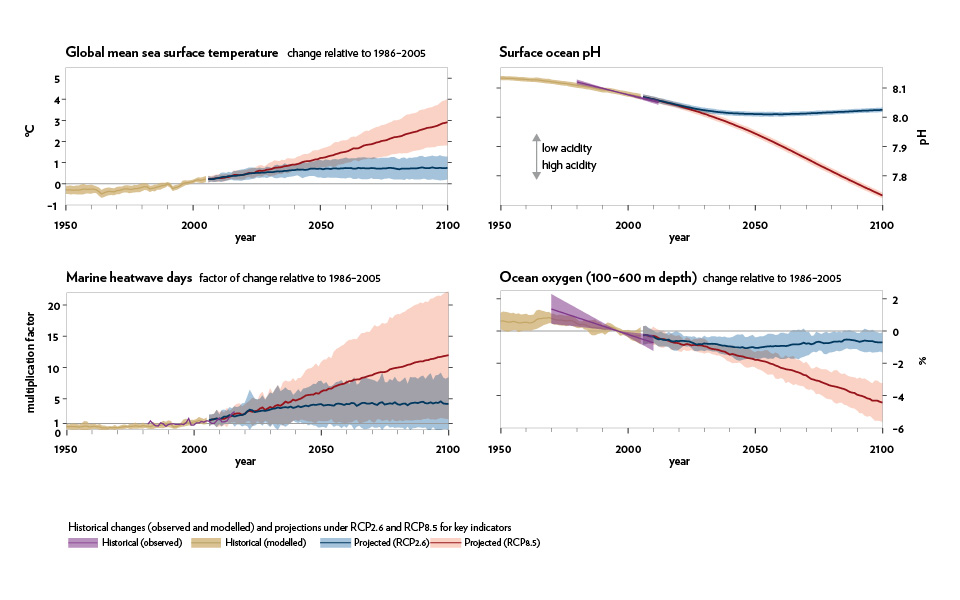
Source: IPCC, 2019: IPCC Special Report on the Ocean and Cryosphere in a Changing Climate [H.-O. Pörtner, D.C. Roberts, V. Masson-Delmotte, P. Zhai, M. Tignor, E. Poloczanska, K. Mintenbeck, A. Alegría, M. Nicolai, A. Okem, J. Petzold, B. Rama, N.M. Weyer (eds.)]
The Arctic is warming faster than any other region on Earth and is already exhibiting dramatic changes in sea ice, ocean, and terrestrial regions—shifts which have outsized influence on both local communities and the global climate system.
Warming in the Arctic is occurring at almost twice the global average. Arctic sea ice has declined by approximately 12 percent per decade since satellite measurements started in the late 1970s.17 The past 13 years have been the lowest sea-ice years ever recorded. In 2020, the end of summer ice extent was the second lowest on record, with 2012 ranking as the record minimum year. Sea ice loss is occurring earlier in the spring each year, while freezing is occurring later in the fall. As a result, much of the sea ice in the Arctic is becoming seasonal rather than year-round, which has implications for the livelihoods and infrastructure of Indigenous communities, shipping, and ocean productivity.
Surface temperature anomaly
Annual Arctic sea ice extent
Arctic sea ice extent, 1981–2019 (million km2)
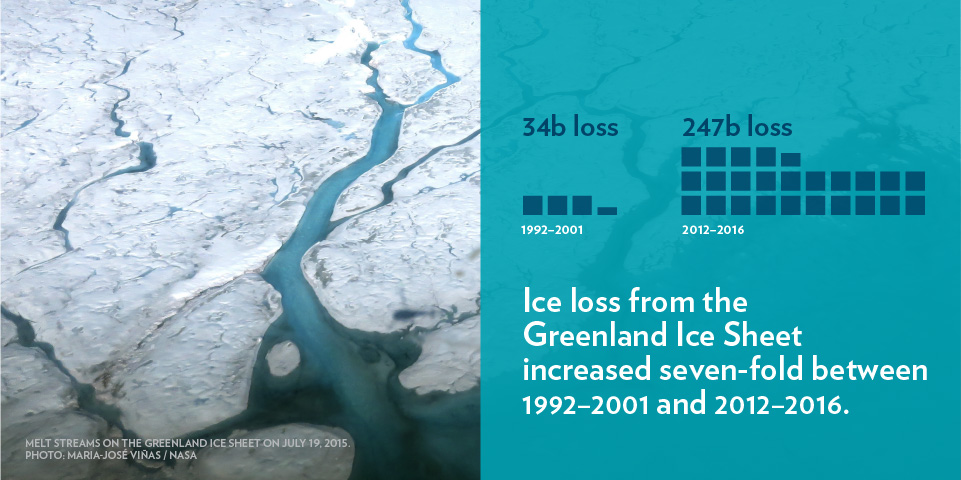
Sea level rise is a direct consequence as the planet warms, ice sheets and glaciers melt, and warming sea water expands. New research shows that global vulnerability to sea level rise is worse than previously understood.
Sea level has risen 8-9 inches (21-24 centimeters) since 1980. The rate of annual sea level rise has accelerated in recent years: it more than doubled from 1.4 millimeters throughout most of the twentieth century to 3.6 mm (0.14 inches) per year since 1993.18 In many places throughout the United States, high-tide flooding along coastlines is now 300-900 percent more frequent than it was 50 years ago.19
Global sea level change
New analysis suggests that by 2050, rising sea levels could push chronic floods higher than land which is currently home to 300 million people, with the threat most concentrated in coastal Asia.20 Although sea level rise is often perceived as an abstract future prospect, the case of low-lying coastal nations such as Bangladesh demonstrate that flooding-driven displacement and economic disruption is a present-day reality. Rising sea level and coastal displacement is expected to place a profound toll on human life and assets and may trigger humanitarian crises around the world.21
Current population at risk of chronic flooding by 2050, top six countries
The ocean is an essential source of climate solutions. Read our Solutions Chapter to learn more about ocean-climate interventions.
Notes
- Casey C. O’Hara, Melanie Frazier, Benjamin S. Halpern. At-risk marine biodiversity faces extensive, expanding, and intensifying human impacts. Science, 2021; 372 (6537): 84 DOI: 10.1126/science.abe6731.
- Halpern, B. et al. (2019). Recent Pace of Change in Human Impact on the World’s Ocean. Scientific Reports 9, no. 1: 11609.
- Diffenbaugh, N.S. 2020. Verification of extreme event attribution: using out-of-sample observations to assess changes in probabilities of unprecedented events. Science Advances 6: 2368.
- IPCC, 2019. “Summary for Policymakers. In: IPCC Special Report on the Ocean and Cryosphere in a Changing Climate.” [H.-O. Pörtner, D.C. Roberts, V. Masson-Delmotte, P. Zhai, M. Tignor, E. Poloczanska, K. Mintenbeck, M. Nicolai, A. Okem, J. Petzold, B. Rama, N. Weyer (eds.)].
- Ibid.
- USGCRP. “Impacts, Risks, and Adaptation in the United States: Fourth National Climate Assessment, Volume II: Report-in-Brief.” [Reidmiller, D.R., C.W. Avery, D.R. Easterling, K.E. Kunkel, K.L.M. Lewis, T.K. Maycock, and B.C. Stewart (eds.)]. U.S. Global Change Research Program, Washington, DC, USA, 2018, 186 pp.
- United Nations Environment Programme (2020). Emissions Gap Report 2020. Nairobi.
- Tollefson, Jeff. “COVID curbed carbon emissions in 2020 — but not by much.” Nature News: January 15 , 2021.
- United Nations Environment Programme (2020). Emissions Gap Report 2020. Nairobi.
- Munich Re. “Record hurricane season and major wildfires – The natural disaster figures for 2020.” https://www.munichre.com/en/company/media-relations/media-information-and-corporate-news/media-information/2021/2020-natural-disasters-balance.html#1105489295. January 7, 2021. (Accessed April 5, 2021.)
- Smith, Adam. NOAA. “2020 U.S. billion-dollar weather and climate disasters in historical context.” January 8, 2021. https://www.climate.gov/news-features/blogs/beyond-data/2020-us-billion-dollar-weather-and-climate-disasters-historical. (Accessed April 5, 2021.)
- Kumari Rigaud, Kanta, Alex de Sherbinin, Bryan Jones, Jonas Bergmann, Viviane Clement, Kayly Ober, Jacob Schewe, Susana Adamo, Brent McCusker, Silke Heuser, and Amelia Midgley. 2018. “Groundswell: Preparing for Internal Climate Migration.” Washington, DC: The World Bank.
- Cheng, L. J., and Coauthors, 2021: Upper ocean temperatures hit record high in 2020. Adv. Atmos. Sci., 38(4), 523−530, https://doi.org/10.1007/s00376-021-0447-x.
- NOAA (National Oceanic and Atmospheric Administration). 2016. Extended reconstructed sea surface temperature (ERSST.v4). National Centers for Environmental Information. Accessed April 2021. www.ncdc.noaa.gov/data-access/marineocean-data/extended-reconstructed-sea-surface-temperature-ersst.
- Ibid.
- Laffoley, D., and J.M. Baxter, eds. “Ocean Deoxygenation: Everyone’s Problem. Causes, Impacts, Consequences and Solutions.” IUCN, International Union for Conservation of Nature, 2019. https://doi.org/10.2305/IUCN.CH.2019.13.en.
- Thoman, R.L., J. Richter-Menge, and M.L. Druckenmiller, Eds.., 2020: Arctic Report Card, 2020, https://doi.org/10.25923/mn5p-t549.
- Lindsey, Rebecca. “Climate Change: Global Sea Level.” NOAA, January 25, 2021, https://www.climate.gov/news-features/understanding-climate/climate-change-global-sea-level. (Accessed April 2, 2021).
- Ibid.
- Kulp, S.A., Strauss, B.H. New elevation data triple estimates of global vulnerability to sea-level rise and coastal flooding. Nat Commun 10, 4844 (2019). https://doi.org/10.1038/s41467-019-12808-z.
- Ibid.