Ocean Pollution Trends
- Plastic leakage into ocean:
- 11MMT in 2016; projected 29 MMT in 2040
- Wastewater discharged untreated:
- 80% of the world’s wastewater
- Access to managed sanitation:
- Only 4 in 10 people worldwide have access.
- Increase in harmful algal blooms:
- 500% reported increase in US from 2010–2020
Jump to:
The ocean is often the final dumping ground for society’s waste. Over 80 percent of land is in a watershed that drains directly into the ocean.1 Industrial, agricultural, and municipal wastes all eventually flow into the ocean. While some of this waste is highly visible (e.g., oil spills and large plastics), other types are less conspicuous but similarly insidious (e.g., toxic chemicals, nutrients, and microplastics). Many sources of coastal and ocean pollution originate on land. However, there is no global framework or treaty requiring states to manage land-based sources of ocean pollution, which leaves a critical gap in management and enforcement. The Source-to-Sea Framework for marine litter prevention shows how land systems, freshwater systems, estuaries, deltas, coasts, the nearshore, adjoining sea shelf, and the open sea are all deeply connected. Efforts to manage pollution must be considered across the land-sea interface.
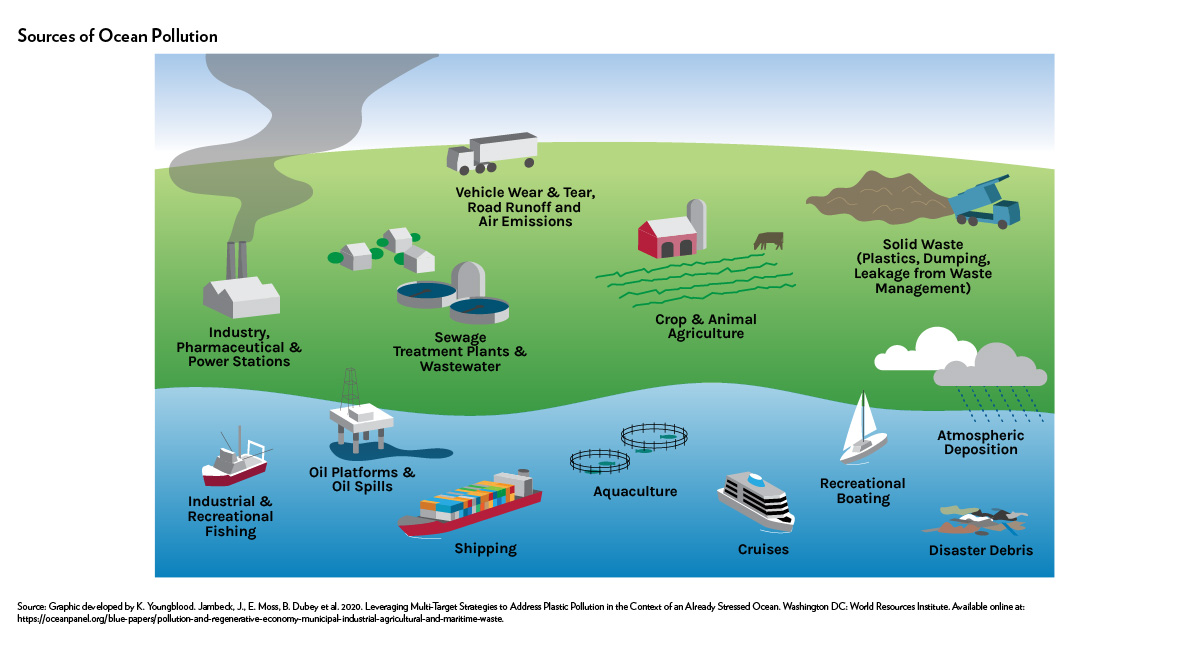
Sources of Ocean Pollution
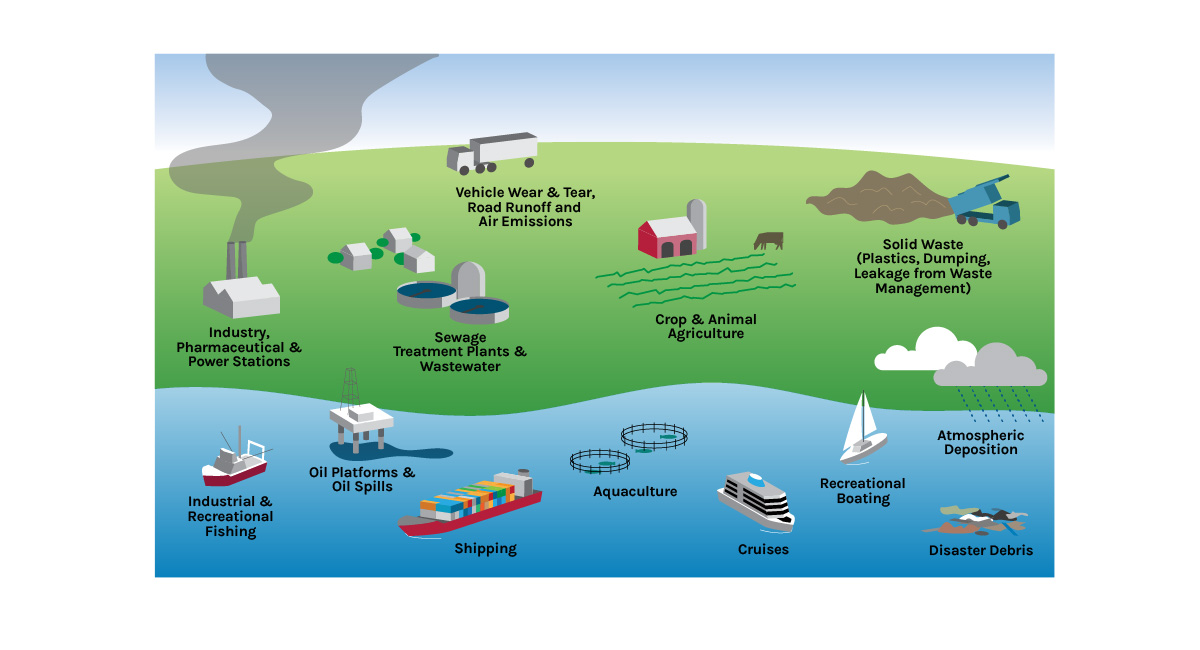
Source: Graphic developed by K. Youngblood. Jambeck, J., E. Moss, B. Dubey et al. 2020. Leveraging Multi-Target Strategies to Address Plastic Pollution in the Context of an Already Stressed Ocean. Washington DC: World Resources Institute. Available online at: https://oceanpanel.org/publication/leveraging-multi-target-strategies-to-address-plastic-pollution-in-the-context-of-an-already-stressed-ocean/.
Below are notable trends in recent years on the toll of pollution and how it impacts ocean health.
The aggregate effect of all pollution on the marine environment is not fully known due to the diffuse nature of sources and incomplete data, but indicators suggest that it is likely worsening. Pollution threats tend to be most acute in coastal and nearshore habitats.
Pollution results in poor water quality, which degrades ecosystems and undermines conservation investments. Pollution appears to be worst in coastal and nearshore environments like mangroves, salt marshes, coral reefs, and seagrasses—places close to where people live, fish, and experience the ocean.2 Declining water quality appears to be the leading cause of seagrass loss globally, which is declining at a rate of 7 percent per year,3 or approximately a football field every 30 minutes.4 When it comes to major threats to ocean health, pollution-related stressors are second only to climate change in terms of cumulative impact and the recent pace of change.
Cumulative human impacts on marine ecosystems
Environmental water quality on land and in the ocean is poorly monitored, making ocean pollution a largely invisible crisis across countries of every income level.
Very few countries around the world have laws that require monitoring of coastal water quality,5 and those that do often struggle to implement and enforce those laws.6 In the United States, only 6 percent of the 58,000 miles of ocean shoreline are monitored regularly for water quality.7 Pollution is a problem shared by countries of every income level: even industrialized regions like the United States and Europe have significant water quality risks alongside countries like India, China, and much of Latin America and North Africa. Water quality is not only an environmental problem: what we do know suggests that water pollution can limit economic growth by a third.8
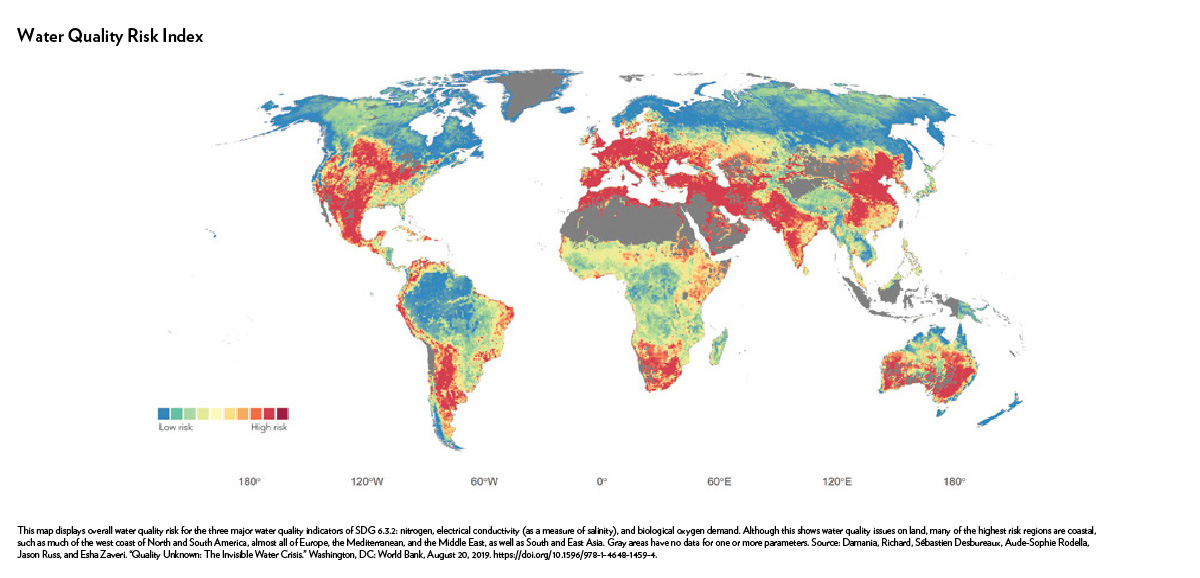
Water quality risk index
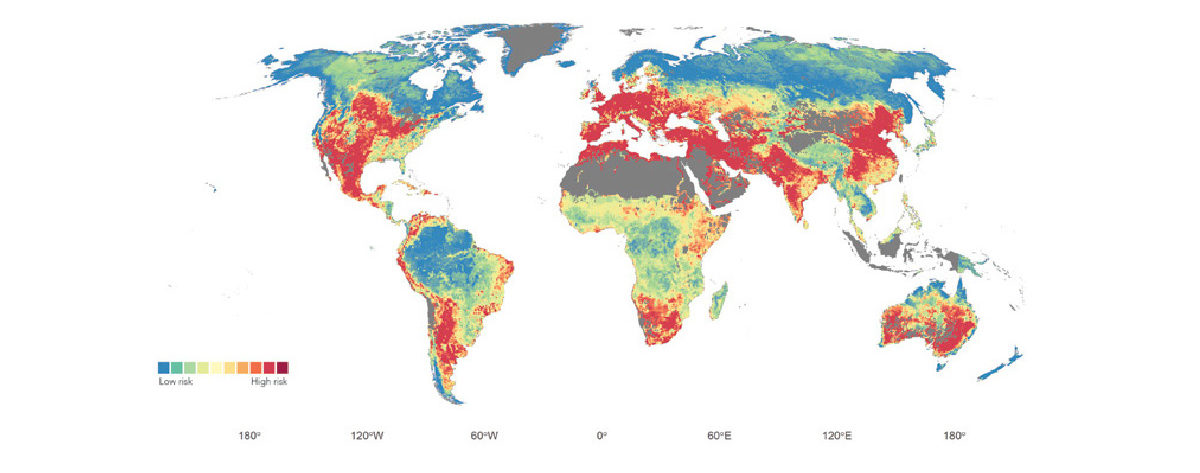
This map displays overall water quality risk for the three major water quality indicators of SDG 6.3.2: nitrogen, electrical conductivity (as a measure of salinity), and biological oxygen demand. Although this shows water quality issues on land, many of the highest risk regions are coastal, such as much of the west coast of North and South America, almost all of Europe, the Mediterranean, and the Middle East, as well as South and East Asia. Gray areas have no data for one or more parameters. Source: Damania, Richard, Sébastien Desbureaux, Aude-Sophie Rodella, Jason Russ, and Esha Zaveri. “Quality Unknown: The Invisible Water Crisis.” Washington, DC: World Bank, August 20, 2019. https://doi.org/10.1596/978-1-4648-1459-4.
Although monitoring is limited, available monitoring data suggests that many of our shorelines, coasts, bays, and estuaries suffer from persistently poor water quality, even in high-income countries. In the United States alone, anywhere from one percent (wetlands) to 86 percent (the Great Lakes) of water bodies are monitored.9 According to the National Water Quality Inventory, 70 percent of lakes, reservoirs, and ponds; 78 percent of bays and estuaries; and 55 percent of rivers and streams assessed in the United States do not meet minimum water quality standards.10 In China, nearly two-thirds of the country’s groundwater and a third of surface waters were rated as unfit for human touch due to contaminated water supplies.11
Water quality inventory in the United States
The plastic waste crisis continues to accelerate, with the flow of plastic into the ocean projected to nearly triple by 2040 under business-as-usual projections.
Plastic flowing into the ocean is estimated to grow from 11 million metrics tons per year in 2016 to 23-37 million metric tons per year by 2040.12 Continued population growth, increases in plastic use per capita, shifts to low-value and non-recyclable materials, and growing plastic consumption in countries with low rates of collection are all factors contributing to the plastic waste crisis. If business-as-usual practices are continued, the next 20 years may result in a doubling of plastic waste generation, a tripling of plastic leakage into the ocean, and a more than quadrupling of plastic stock in the ocean.13
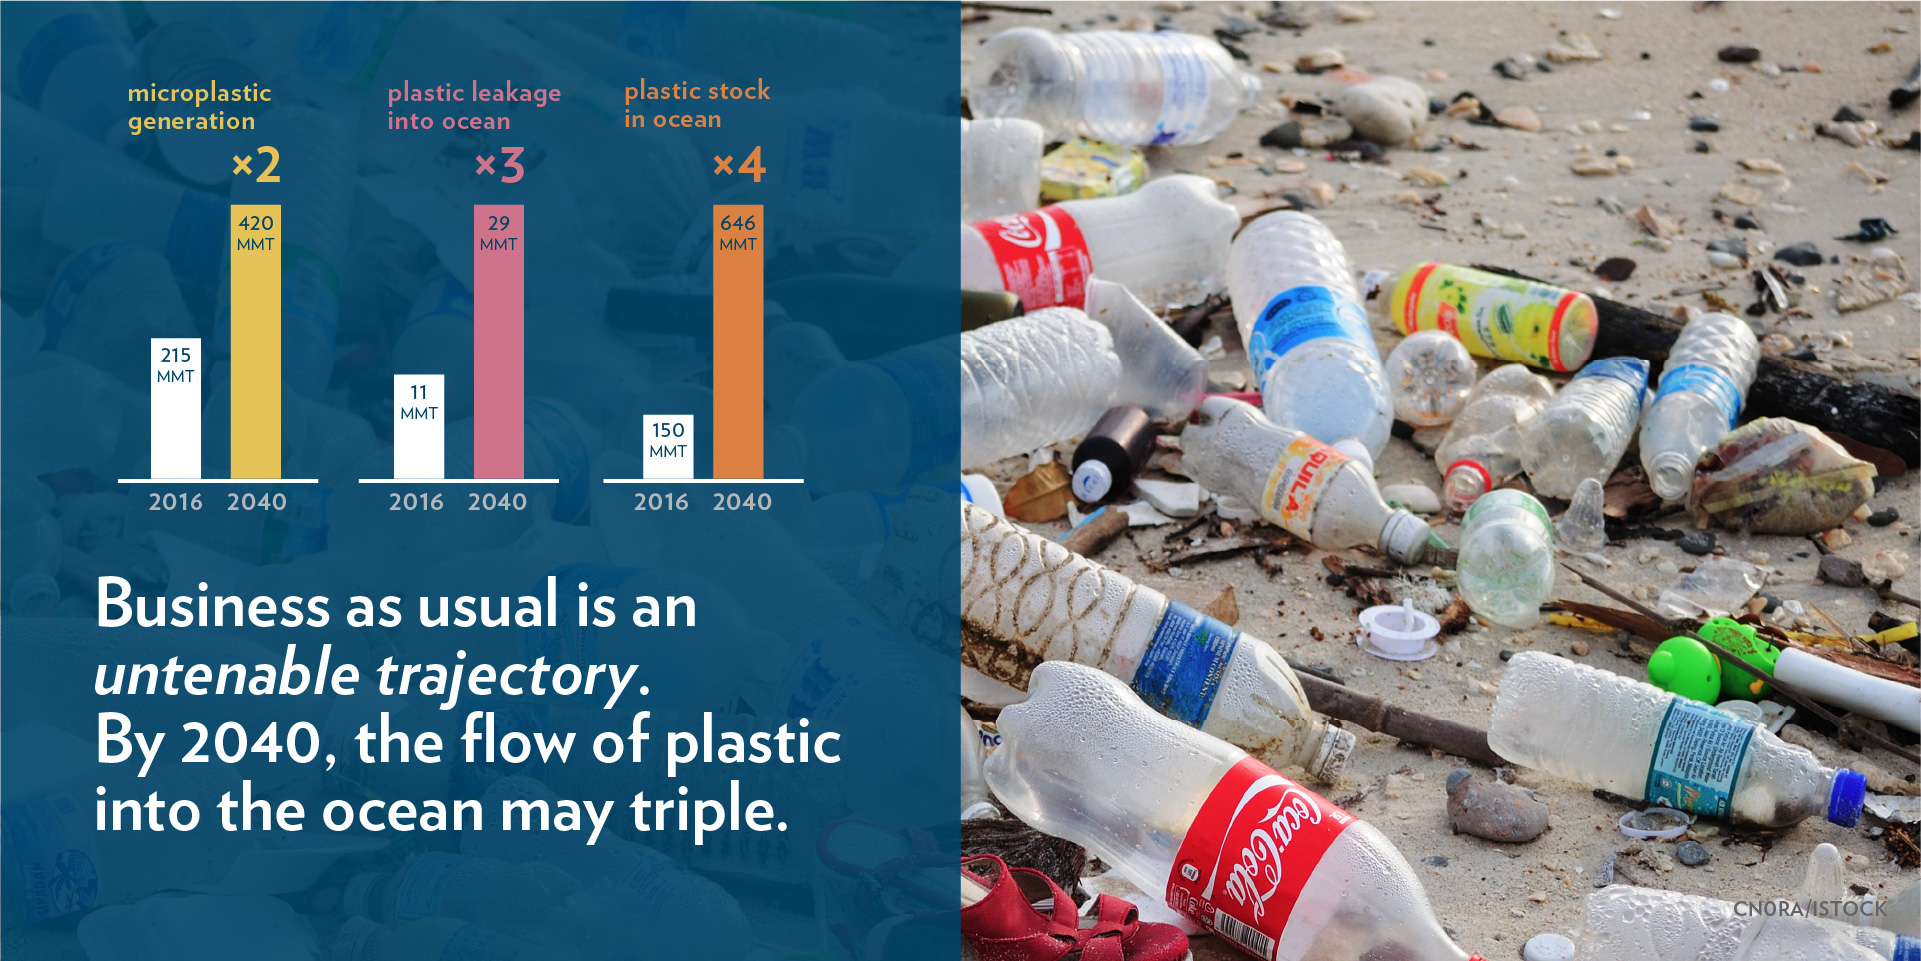
Adapted from source: PEW Charitable Trusts and SystemIQ. “Breaking the Plastic Wave,” July 23, 2020. https://www.pewtrusts.org/-/media/assets/2020/10/breakingtheplasticwave_mainreport.pdf
Land-based plastic leakage into the ocean, under different scenarios
New research shows that implementing a suite of eight systems-change interventions could reduce plastic pollution by 80 percent and save governments USD 70 billion in present value between 2021 and 2040.14 Currently, there are important government, NGO, and corporate initiatives in place to address plastic waste and leakage into the ocean, but they are not sufficient to drive the changes required. In fact, current government and industry commitments are likely to reduce annual plastic leakage into the ocean by only 7 percent relative to business-as-usual levels.
Highlights from "Breaking the Plastic Wave" report
Excerpted from the Pew report:
Industry and governments have the solutions today to reduce rates of annual land-based plastic leakage into the ocean by about 80 per cent (82 ±13 per cent) below projected BAU levels by 2040, while delivering on other societal, economic, and environmental objectives. Here are the eight systems-change interventions:
- Reduce growth in plastic production and consumption to avoid nearly one-third of projected plastic waste generation through elimination, reuse, and new delivery models.
- Substitute plastic with paper and compostable materials, switching one-sixth of projected plastic waste generation.
- Design products and packaging for recycling to expand the share of economically recyclable plastic from an estimated 21 per cent to 54 per cent.
- Expand waste collection rates in the middle-/low-income countries to 90 per cent in all urban areas and 50 per cent in rural areas and support the informal collection sector.
- Double mechanical recycling capacity globally to 86 million metric tons per year.
- Develop plastic-to-plastic conversion, potentially to a global capacity of up to 13 million metric tons per year.
- Build facilities to dispose of the 23 per cent of plastic that cannot be recycled economically, as a transitional measure.
- Reduce plastic waste exports by 90 per cent to countries with low collection and high leakage rates.
Source: PEW Charitable Trusts and SystemIQ. “Breaking the Plastic Wave,” July 23, 2020. Download the report.
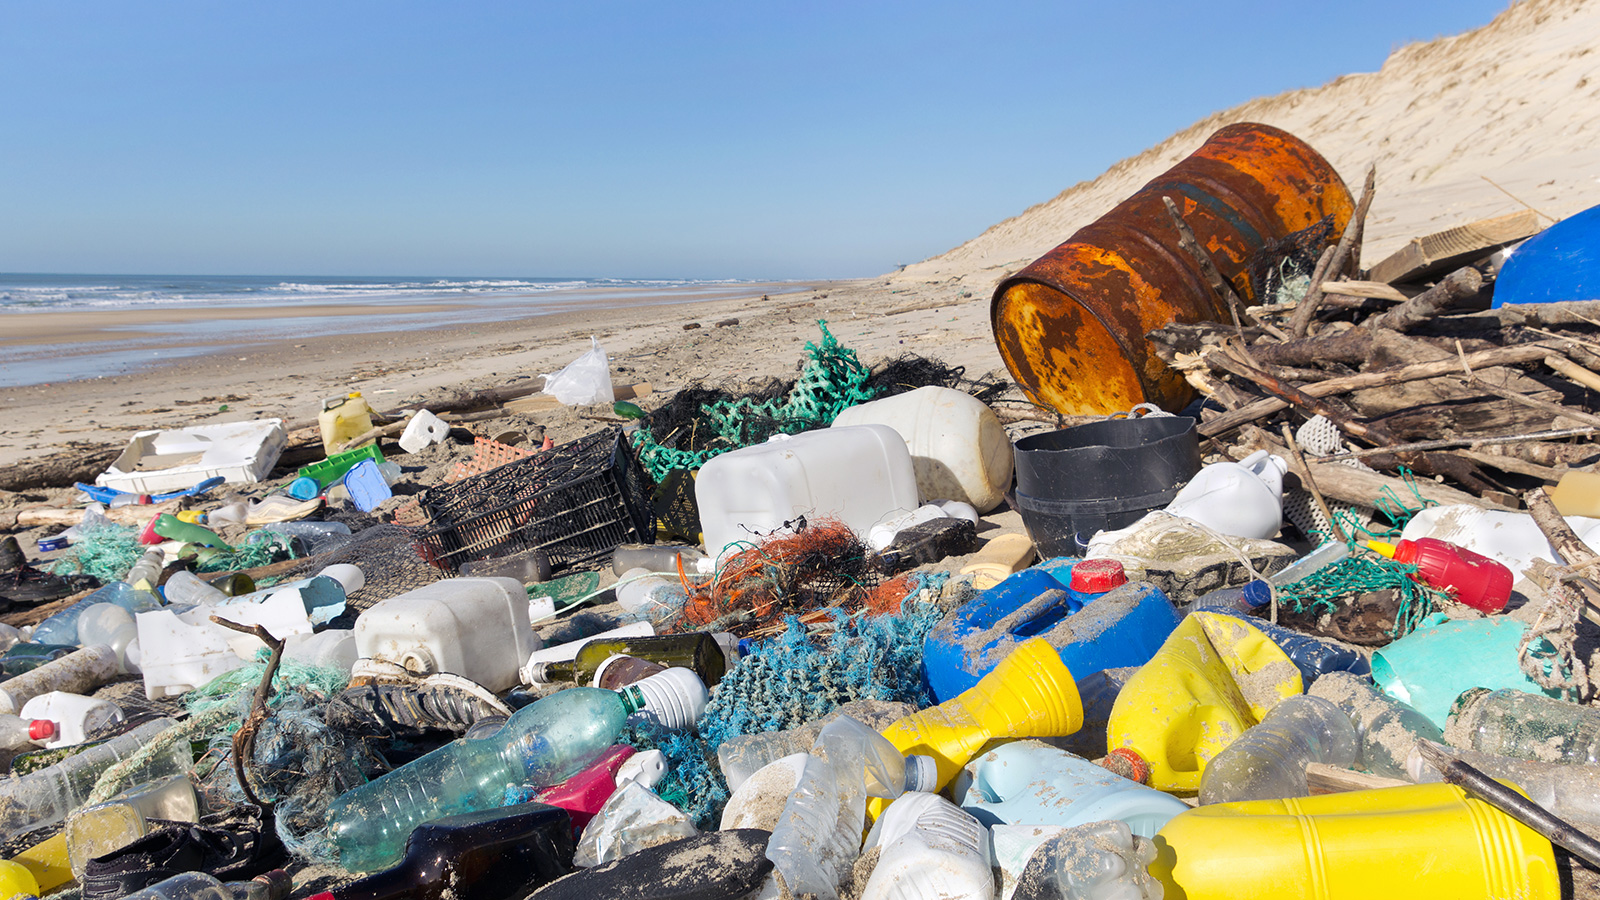
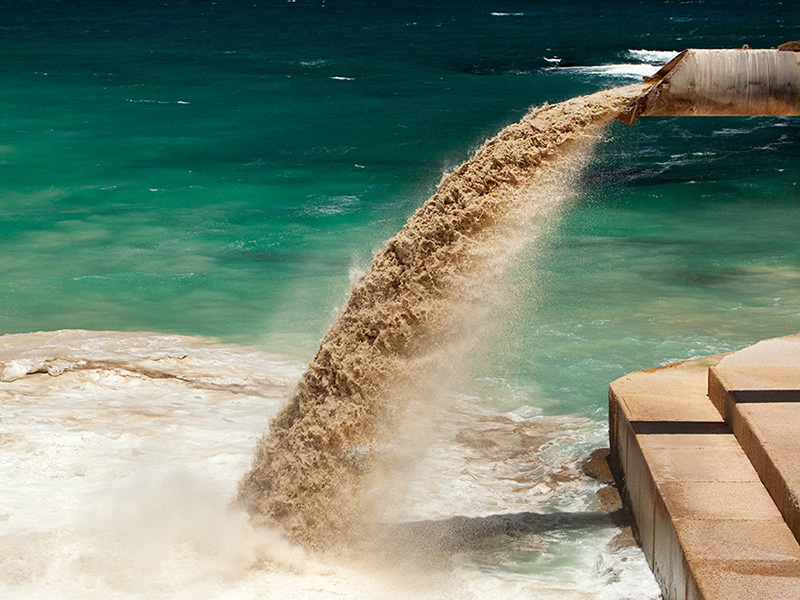
Recycling infrastructure even in the United States requires significant restructuring according to recent reports. Plastic waste leakage from the U.S. into the local environment was 2.24 million metrics tons in 2016, of which roughly half was deposited along coastlines with a high probability of entering the ocean. Photo: Sablin / iStock
The greatest volume of waste growth by 2050 is expected to be in South Asia and Sub-Saharan Africa, with estimated waste levels expected to double and triple respectively by 2050.15 While all other regions will see waste growth, the rate of growth is expected to be more gradual. On a per capita basis, North America is still expected to generate anywhere from two to four times more waste than any other region.16 (This projection extends to multiple types of waste, not limited to plastic. It includes food waste, glass, metal, paper and cardboard, plastic, rubber and leather, wood, and other materials.)
Projected waste generation by region
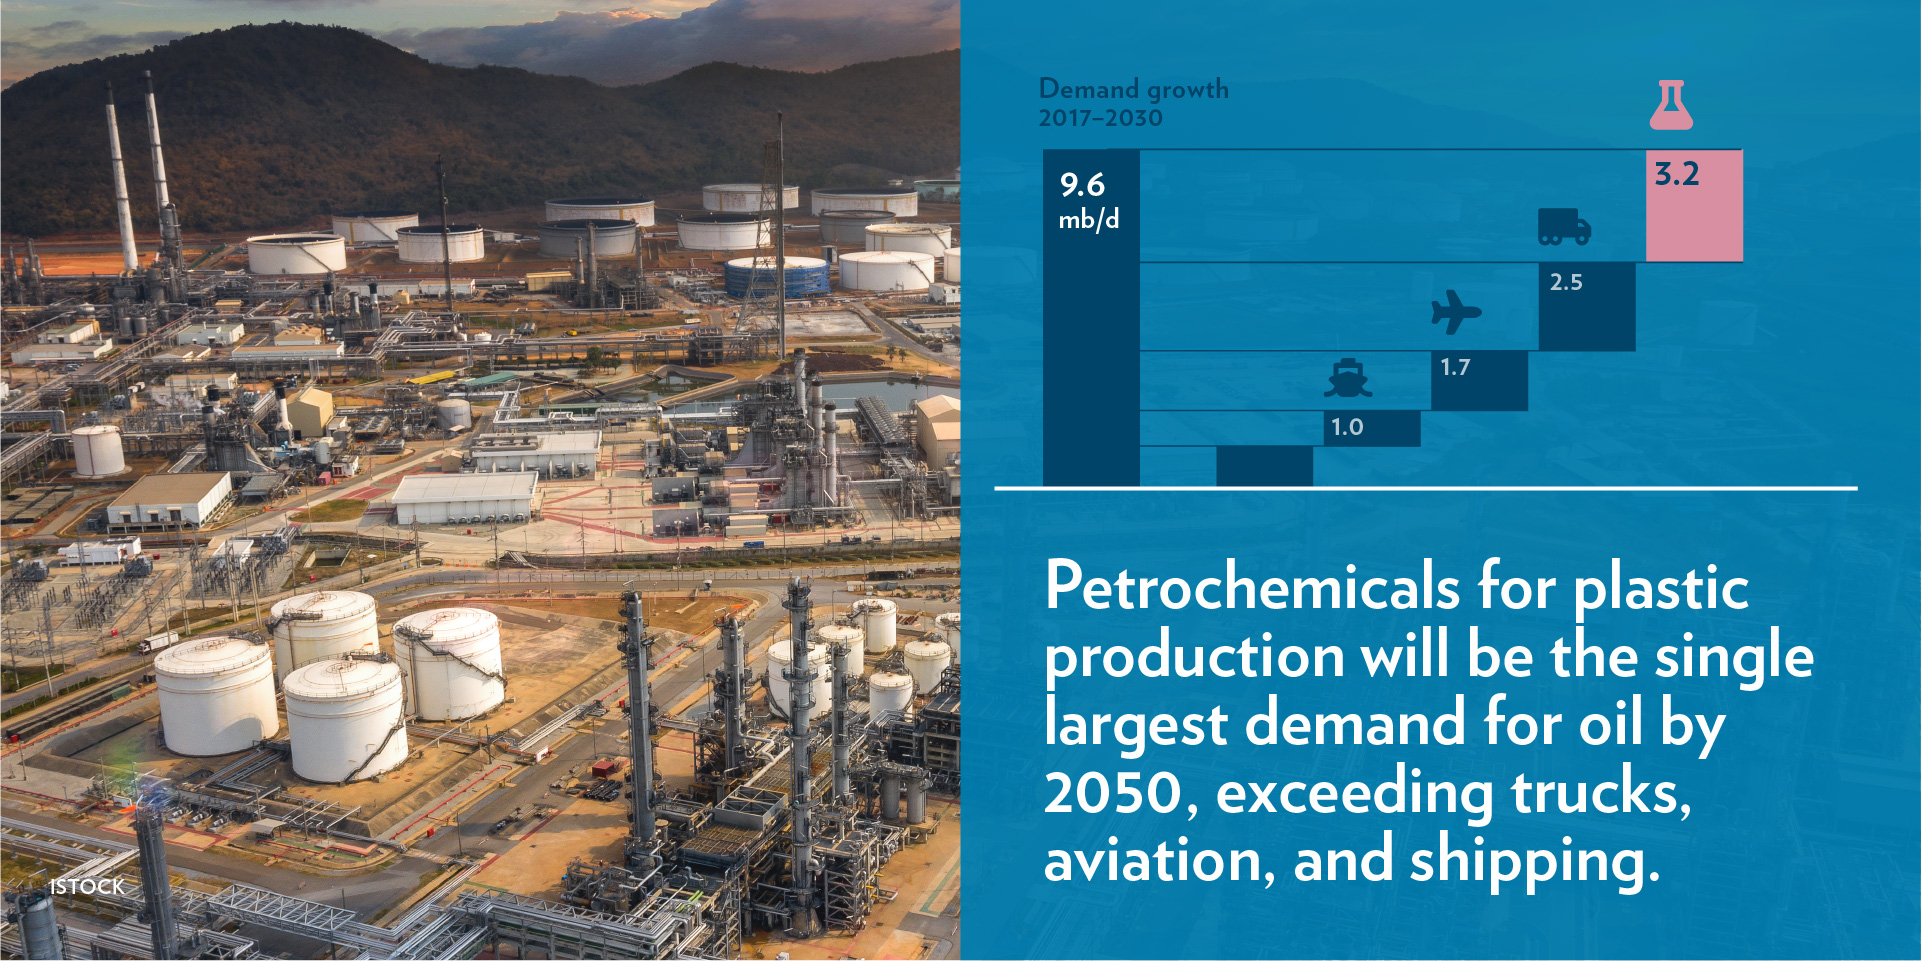
Plastic pollution is not only an ocean issue; the growing role of emissions from plastics is one of the key blind spots in the global energy debate.
Petrochemicals used to make plastic are increasingly becoming the largest driver of global oil consumption, expected to account for more than a third of the growth in oil demand to 2030 and nearly half to 2050—more market share than trucks, aviation, and shipping.17 Petrochemicals are also poised to consume an additional 56 billion cubic meters of natural gas by 2030, equivalent to about half of Canada’s total gas consumption today.18 Importantly, emissions from plastics are likely to replace the dominant sources of oil demand today—passenger vehicles—due to improvements in fuel economy, growing public transport, alternative fuels, and electrification.
Annual demand for plastic has almost doubled since 2000. If the growth of plastic production, disposal, and incineration continues unabated, emissions from plastics are expected to reach 1.3 gigatonnes per year by 2030 and 2.8 gigatonnes per year by 2050—equivalent to roughly 300 and 600 coal-fired power plants, respectively.19
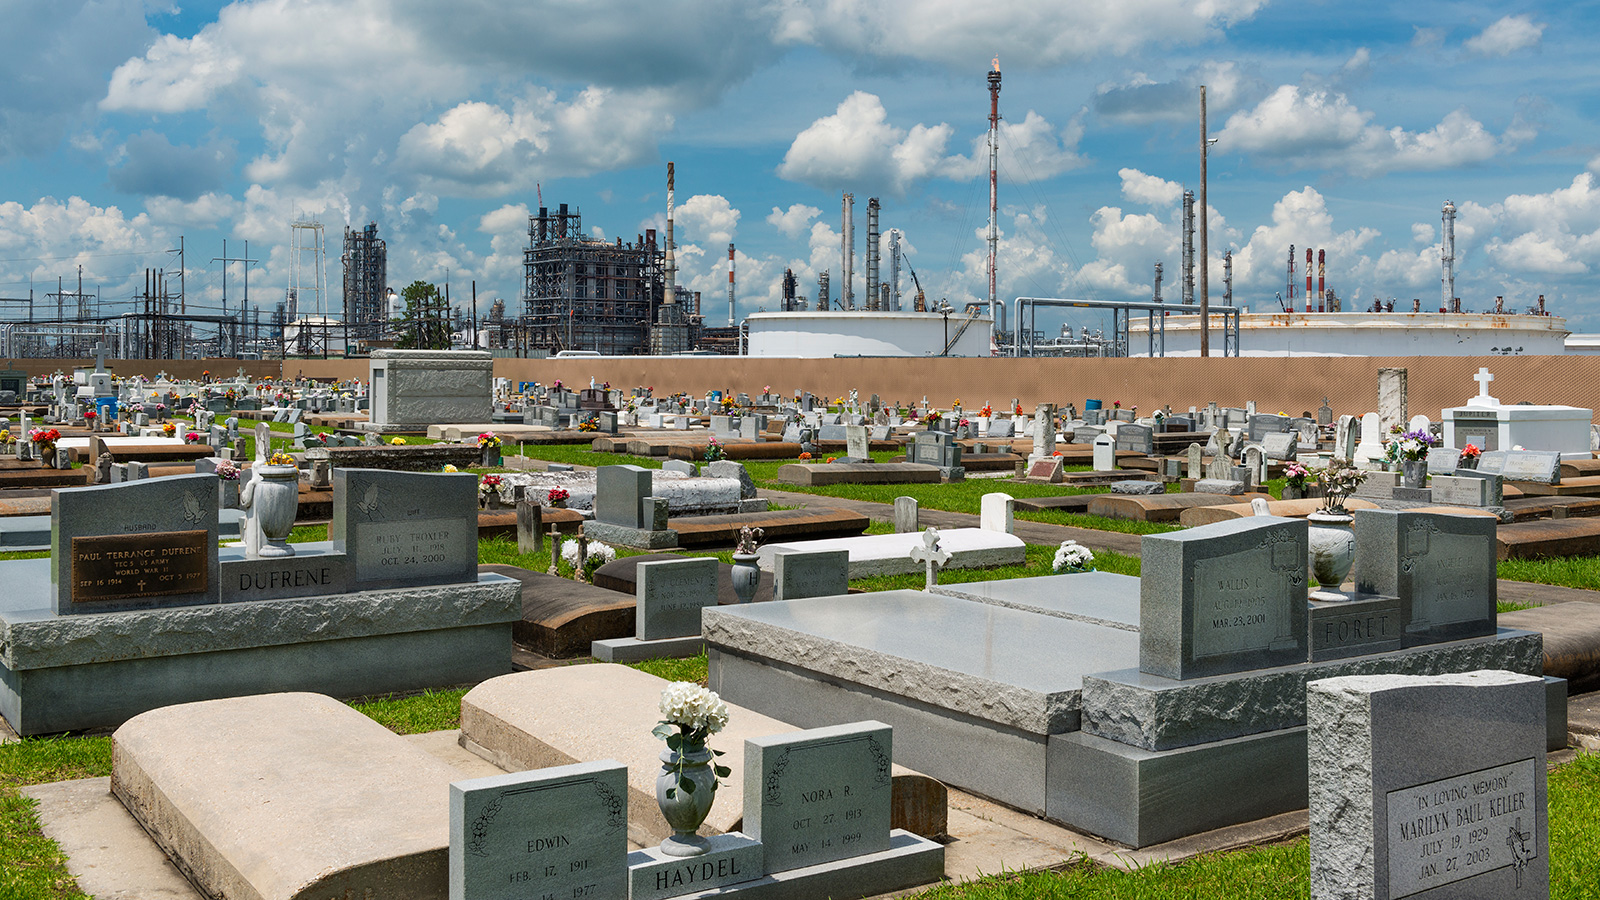
View of the Holy Rosary Cemetery in Taft, Louisiana (in the so called ‘Cancer Alley’), with a petrochemical plant on the background. Photo: Tiago_Fernandez / iStock
The plastic waste crisis is an environmental justice challenge; the impacts of pollution disproportionately affect structurally marginalized communities—in high- and low-income countries alike.
Even within the United States, the increase in demand for plastics is increasing the number of polluting petrochemical plants in already vulnerable areas, polluting the surrounding air and water and causing cancer, respiratory diseases, and other health problems. For example, “Cancer Alley” in the St. James Parish of the U.S. state of Louisiana has nearly 150 oil refineries, plastics plants, and chemical facilities that contribute to some of the worst air and water pollution in the country, disproportionately affecting Black residents and low-income communities. Cancer risks in predominantly Black districts in St. James Parish are at 104–105 cases per million, while the threats in predominantly white districts range from 60–75 cases per million.20 Overall, residents in the town of Reserve, Louisiana are 50 times more likely to get cancer than the average American.21 With an additional 327 plants in the planning phases, construction, or recently completed in Texas and Louisiana, these pollution problems in the U.S. Gulf Coast are expected to intensify in coming years.22
In spite of an international treaty banning the practice,23 rich countries continue to export plastic to poorer countries with weaker waste management—ostensibly to be recycled—but much of that plastic ends up in rivers and the ocean. Although 180 nations have agreed to the Basel Convention agreement on plastic, the United States is not one of them. The U.S. continues to be one of the world’s largest consumers of plastic and continues to ship plastic waste overseas.24
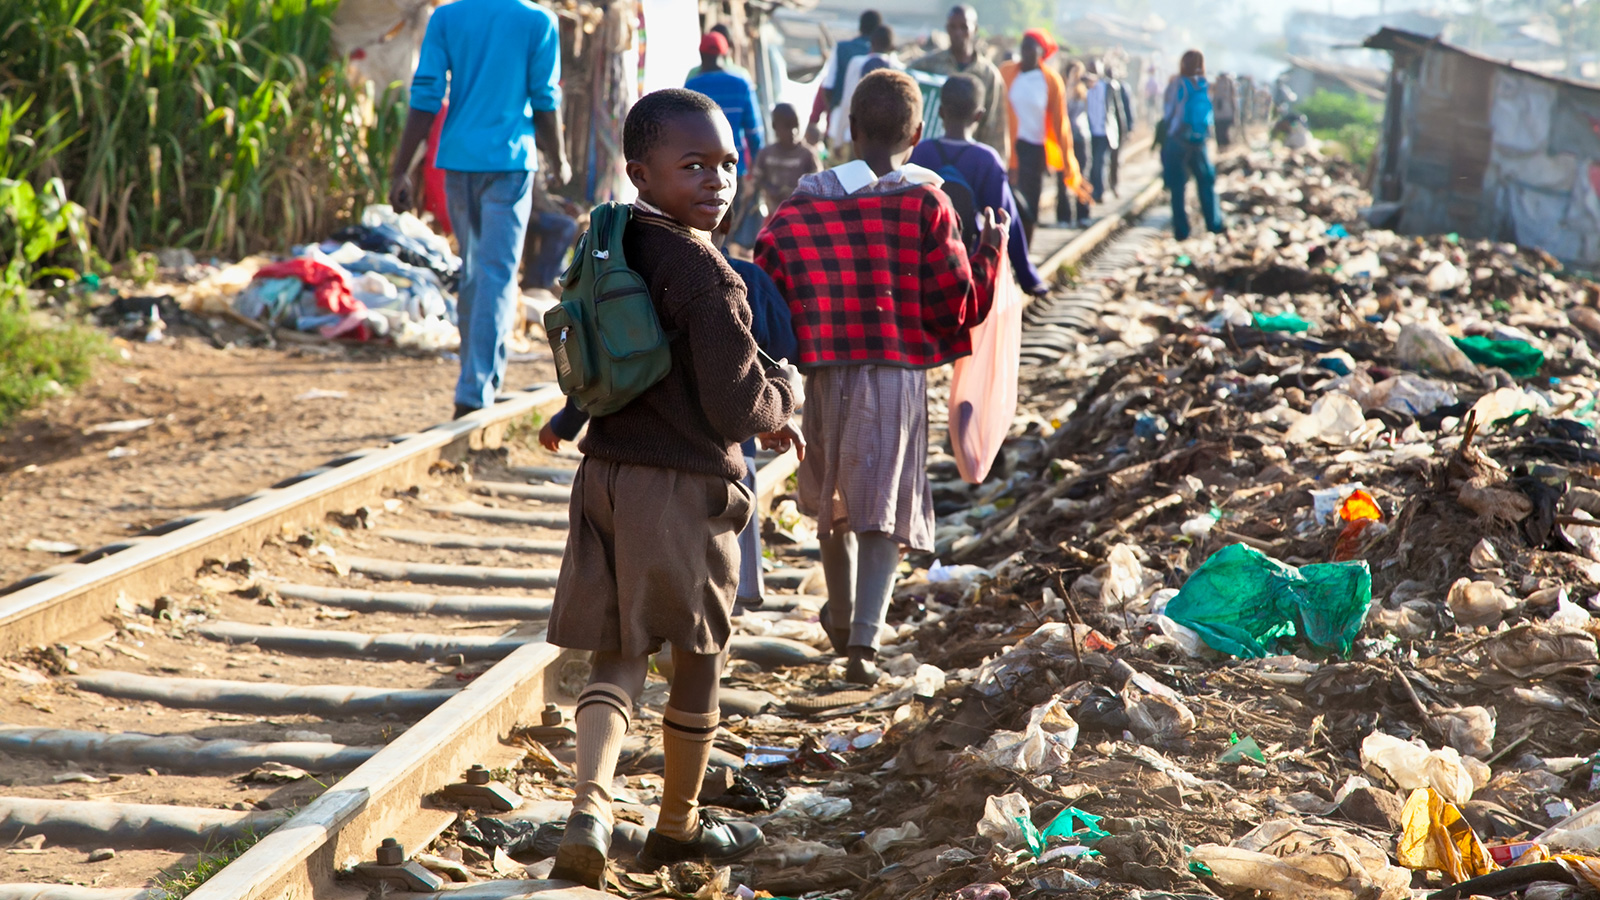
The United States produces more plastic waste per capita than any other country. Historically, the U.S. has shipped roughly half of its recyclable plastic oversees, often to developing countries that lack the infrastructure to manage it. After China refused to accept plastic trash at its ports in 2018, plastic exports to Africa more than quadrupled in 2019, as compared to the previous year. Children in a slum in Nairobi, Kenya. Photo: master2 / iStock
The large-scale input of nutrients is increasing globally due to persistent pollution from agriculture, livestock, and sewage. These nutrient inputs have led to a rise in harmful algal blooms which have wide-ranging ecological, economic, and public health impacts.
When nutrients from fertilizers, untreated sewage, and urban areas run off into water bodies, they can fuel the growth of harmful algae through a process known as eutrophication. Nutrient pollution is a global phenomenon, with over 700 coastal areas globally affected by eutrophication, with well-documented hotspots in the U.S. Gulf of Mexico and much of coastal Europe.25 This problem is not unique to the United States and Europe: a recent study of China’s waters showed harmful algal blooms increasing in frequency by 40 percent per decade between 1970–2015.26 Given the lack of water quality monitoring data globally, nutrient pollution may be a far more widespread problem than is currently understood.
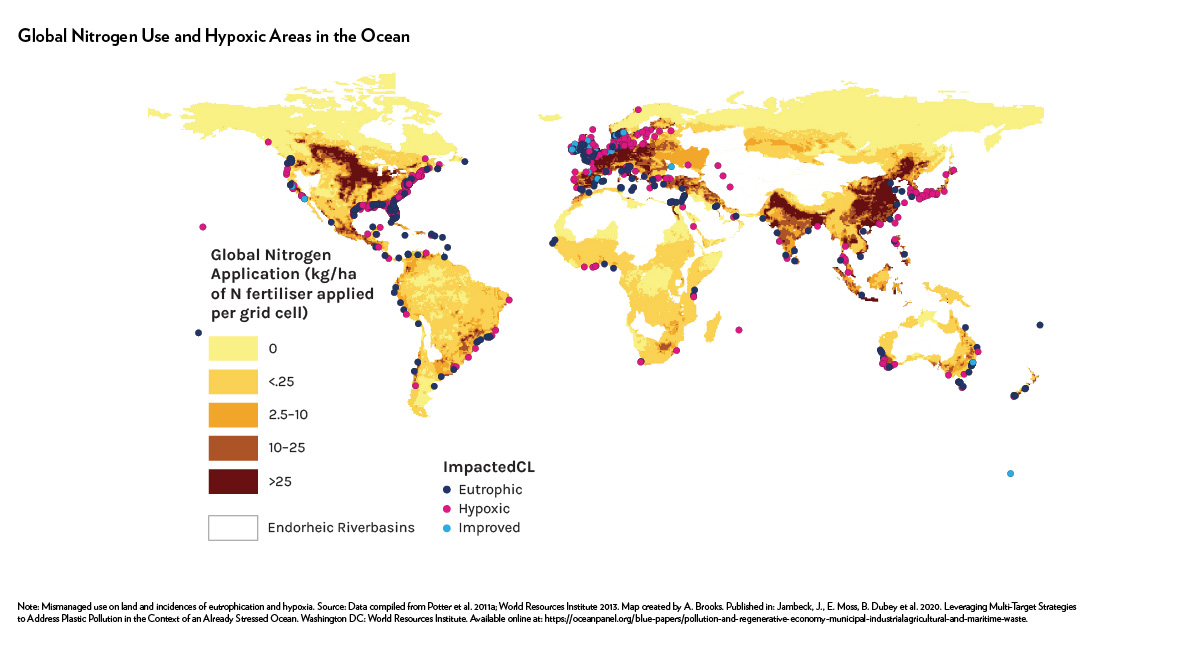
Global nitrogen use and hypoxic areas in the ocean
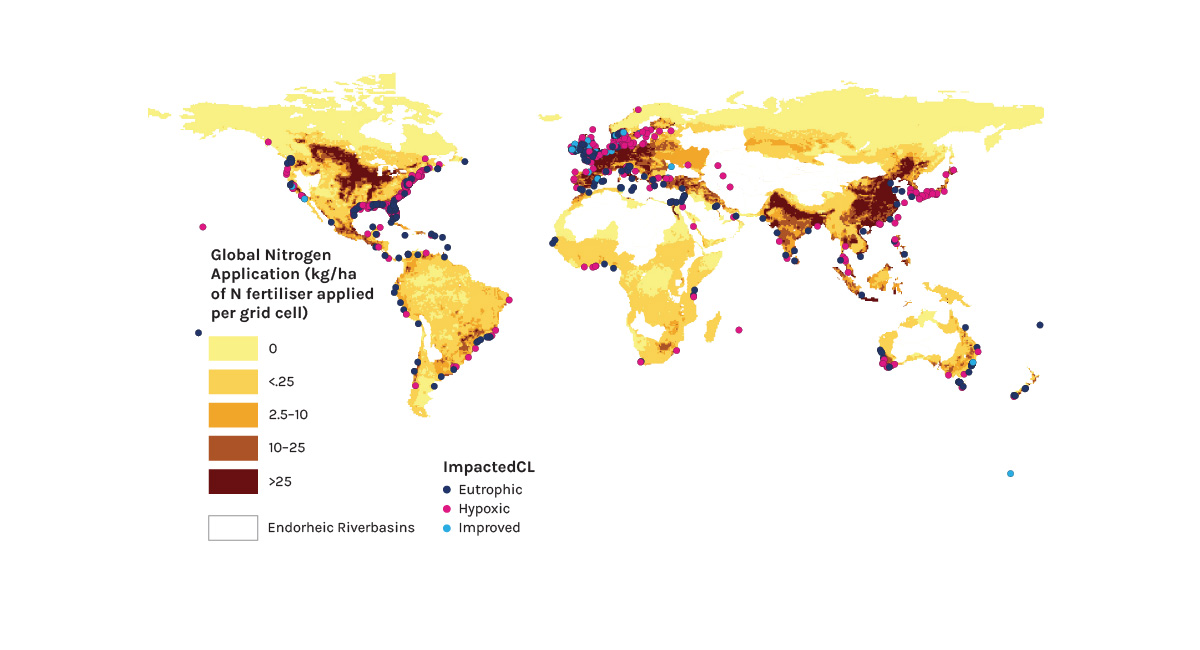
Note: Mismanaged use on land and incidences of eutrophication and hypoxia. Source: Data compiled from Potter et al. 2011a; World Resources Institute 2013. Map created by A. Brooks. Published in: Jambeck, J., E. Moss, B. Dubey et al. 2020. Leveraging Multi-Target Strategies to Address Plastic Pollution in the Context of an Already Stressed Ocean. Washington DC: World Resources Institute. Available online at: https://oceanpanel.org/publication/leveraging-multi-target-strategies-to-address-plastic-pollution-in-the-context-of-an-already-stressed-ocean/.
Although harmful algal blooms are not a new phenomenon, they appear to be increasing both in frequency, breadth, and severity. These harmful algal blooms (HABs) not only cause fish kills, odors, and discoloration, they can produce potent toxins that can kill animals and cause neurological, respiratory, and gastrointestinal disease in humans.
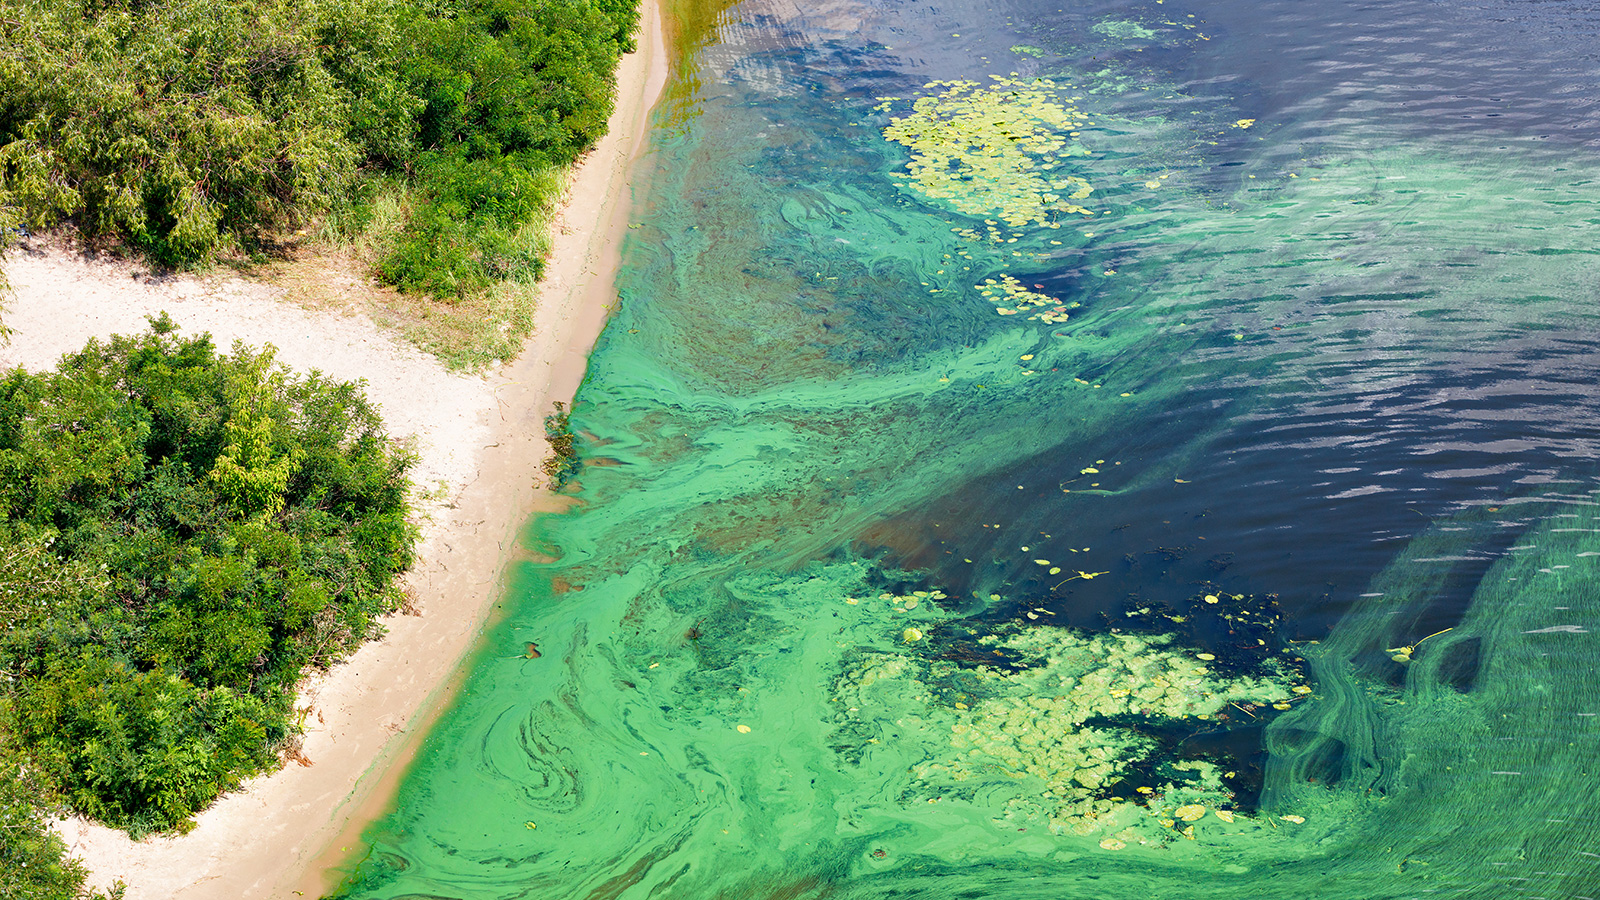
Photo: Sergil Petruk / iStock
Time series of all recorded marine HAB events in the United States
Solutions are at hand to address the threats of ocean pollution. Read our Solutions Chapter to discover the landscape of practical interventions.
Notes
- Lehner, Bernhard, and Günther Grill. “Global River Hydrography and Network Routing: Baseline Data and New Approaches to Study the World’s Large River Systems.” Hydrological Processes 27, no. 15 (July 15, 2013): 2171–86. https://doi.org/10.1002/hyp.9740.
- Halpern, Benjamin S., Melanie Frazier, Jamie Afflerbach, Julia S. Lowndes, Fiorenza Micheli, Casey O’Hara, Courtney Scarborough, and Kimberly A. Selkoe. “Recent Pace of Change in Human Impact on the World’s Ocean.” Scientific Reports 9, no. 1 (December 2019): 11609. https://doi.org/10.1038/s41598-019-47201-9.
- Evans, Suzanna M., Kingsley J. Griffin, Ray A. J. Blick, Alistair G. B. Poore, and Adriana Vergés. “Seagrass on the Brink: Decline of Threatened Seagrass Posidonia Australis Continues Following Protection.” Edited by Erik Sotka. PLOS ONE 13, no. 4 (April 6, 2018): e0190370. https://doi.org/10.1371/journal.pone.0190370.
- Cimons, Marlene. “Oceans Are Losing a Football Field of Seagrass Every 30 Minutes.” Popular Science (blog), November 15, 2018. https://www.popsci.com/oceans-losing-seagrass-carbon-sink/.
- Ibid.
- United Nations Environment Programme. “Environmental Rule of Law: First Global Report,” January 24, 2019. https://www.unep.org/resources/assessment/environmental-rule-law-first-global-report.
- U.S. Environmental Protection Agency. “EPA’s BEACH Report: 2011 Swimming Season.” Washington, D.C., June 2012. https://archive.epa.gov/epa/sites/production/files/documents/national_facsheet_2011.pdf.
- Damania, Richard, Sébastien Desbureaux, Aude-Sophie Rodella, Jason Russ, and Esha Zaveri. “Quality Unknown: The Invisible Water Crisis.” Washington, DC: World Bank, August 20, 2019. https://doi.org/10.1596/978-1-4648-1459-4.
- U.S. Environmental Protection Agency. “National Summary of State Information,” 2017. https://ofmpub.epa.gov/waters10/attains_nation_cy.control#total_assessed_waters.
- National Association of Conservation Districts. “Water.” Accessed April 29, 2021. https://www.nacdnet.org/about-nacd/what-we-do/water/.
- Stanway, David, and Kathy Chen. “Most of Northern China’s Water Is ‘Unfit for Human Touch’. But Here’s What’s Being Done.” World Economic Forum, June 28, 2017. https://www.weforum.org/agenda/2017/06/most-of-northern-chinas-water-is-unfit-for-human-touch-but-heres-whats-being-done/.
- PEW Charitable Trusts and SystemIQ. “Breaking the Plastic Wave,” July 23, 2020. https://www.pewtrusts.org/-/media/assets/2020/10/breakingtheplasticwave_mainreport.pdf.
- Ibid.
- Ibid.
- Kaza, Slipa, Lisa Yao, Perinaz Bhada-Tata, Frank Van Woerden, Kremena lonkova, John Morton, Renan Alberto Poveda, et al. What a Waste 2.0: A Global Snapshot of Solid Waste Management to 2050. Urban Development Series. Washington, DC, USA: World Bank Group, 2018.
- Ibid.
- IEA. “The Future of Petrochemicals.” Paris: IEA, 2018. https://www.iea.org/reports/the-future-of-petrochemicals.
- Ibid.
- Center for International Environmental Law. “Plastic & Climate: The Hidden Costs of a Plastic Planet.” CIEL, 2019. https://www.ciel.org/wp-content/uploads/2019/05/Plastic-and-Climate-Executive-Summary-2019.pdf.
- “Environmental Racism in Louisiana’s ‘Cancer Alley’, Must End, Say UN Human Rights Experts.” UN News, March 2, 2021. https://news.un.org/en/story/2021/03/1086172.
- Pasley, James. “Inside Louisiana’s Horrifying ‘Cancer Alley,’ an 85-Mile Stretch of Pollution and Environmental Racism That’s Now Dealing with Some of the Highest Coronavirus Death Rates in the Country.” Business Insider, April 9, 2020. https://www.businessinsider.com/louisiana-cancer-alley-photos-oil-refineries-chemicals-pollution-2019-11.
- Waxman, Andrew R, Achmad Khomaini, Benjamin D Leibowicz, and Sheila M Olmstead. “Emissions in the Stream: Estimating the Greenhouse Gas Impacts of an Oil and Gas Boom.” Environmental Research Letters 15, no. 1 (January 13, 2020): 014004. https://doi.org/10.1088/1748-9326/ab5e6f.
- Parker, Laura. “Shipping Plastic Waste to Poor Countries Just Got Harder.” National Geographic, May 10, 2019, sec. Environment. https://www.nationalgeographic.com/environment/article/shipping-plastic-waste-to-poor-countires-just-got-harder.
- Tabuchi, Hiroko, and Michael Corkery. “Countries Tried to Curb Trade in Plastic Waste. The U.S. Is Shipping More.” The New York Times, March 12, 2021, sec. Climate. https://www.nytimes.com/2021/03/12/climate/plastics-waste-export-ban.html.
- Walker, Sara. “In World That Says It’s Cutting Nutrient Pollution, Progress Is Lacking.” World Resources Institute, March 4, 2019. https://www.wri.org/insights/world-says-its-cutting-nutrient-pollution-progress-lacking.
- Xiao, Xi, Susana Agustí, Yaoru Pan, Yan Yu, Ke Li, Jiaping Wu, and Carlos M. Duarte. “Warming Amplifies the Frequency of Harmful Algal Blooms with Eutrophication in Chinese Coastal Waters.” Environmental Science & Technology 53, no. 22 (November 19, 2019): 13031–41. https://doi.org/10.1021/acs.est.9b03726.