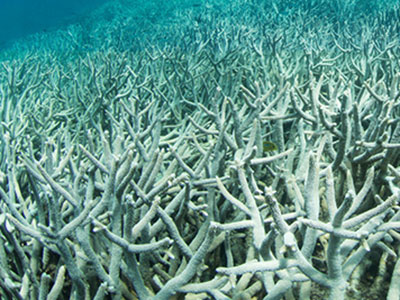
Photo: The Ocean Agency / XL Catlin Sewaview Survey
Habitat and Biodiversity Loss Trends
- Marine species not yet classified:
- Estimated 75–90%
- Unmapped, unobserved, and unexplored ocean:
- 80%
- Extent of coral reef loss:
- 50% loss since 1870
- Extent of mangrove loss:
- 40% loss since 1970
- Designated MPAs:
- 7% of ocean (May 2021)
- MPAs in implemented and fully/highly protected zones:
- 2.7% (May 2021)
Jump to:
Marine habitats and biodiversity are declining faster than at any other time in human history.1 While biodiversity and habitat decline can seem like a niche concern, far removed from the daily lives of most people, it has vital connections to the health and prosperity of humanity—whether through the integrity of food and health systems to the discovery of new drugs or the disruption of entire supply chains. Habitat loss and encroachment can also introduce new viruses that destabilize society, public health, and the global economy.2 The conservation of biodiversity is reflected in both national and international goals, such as targets in the United Nations Convention on Biological Diversity (CBD) and Sustainable Development Goal 14. In October 2021, governments will negotiate a post-2020 global framework for biodiversity at the Conference of the Parties 15 (COP15) in Kunming, China. The current target for this negotiation includes a goal to protect at least 30 percent of the ocean by 2030.
A synthesis of recent trends in the status of marine biodiversity and habitats is outlined below.
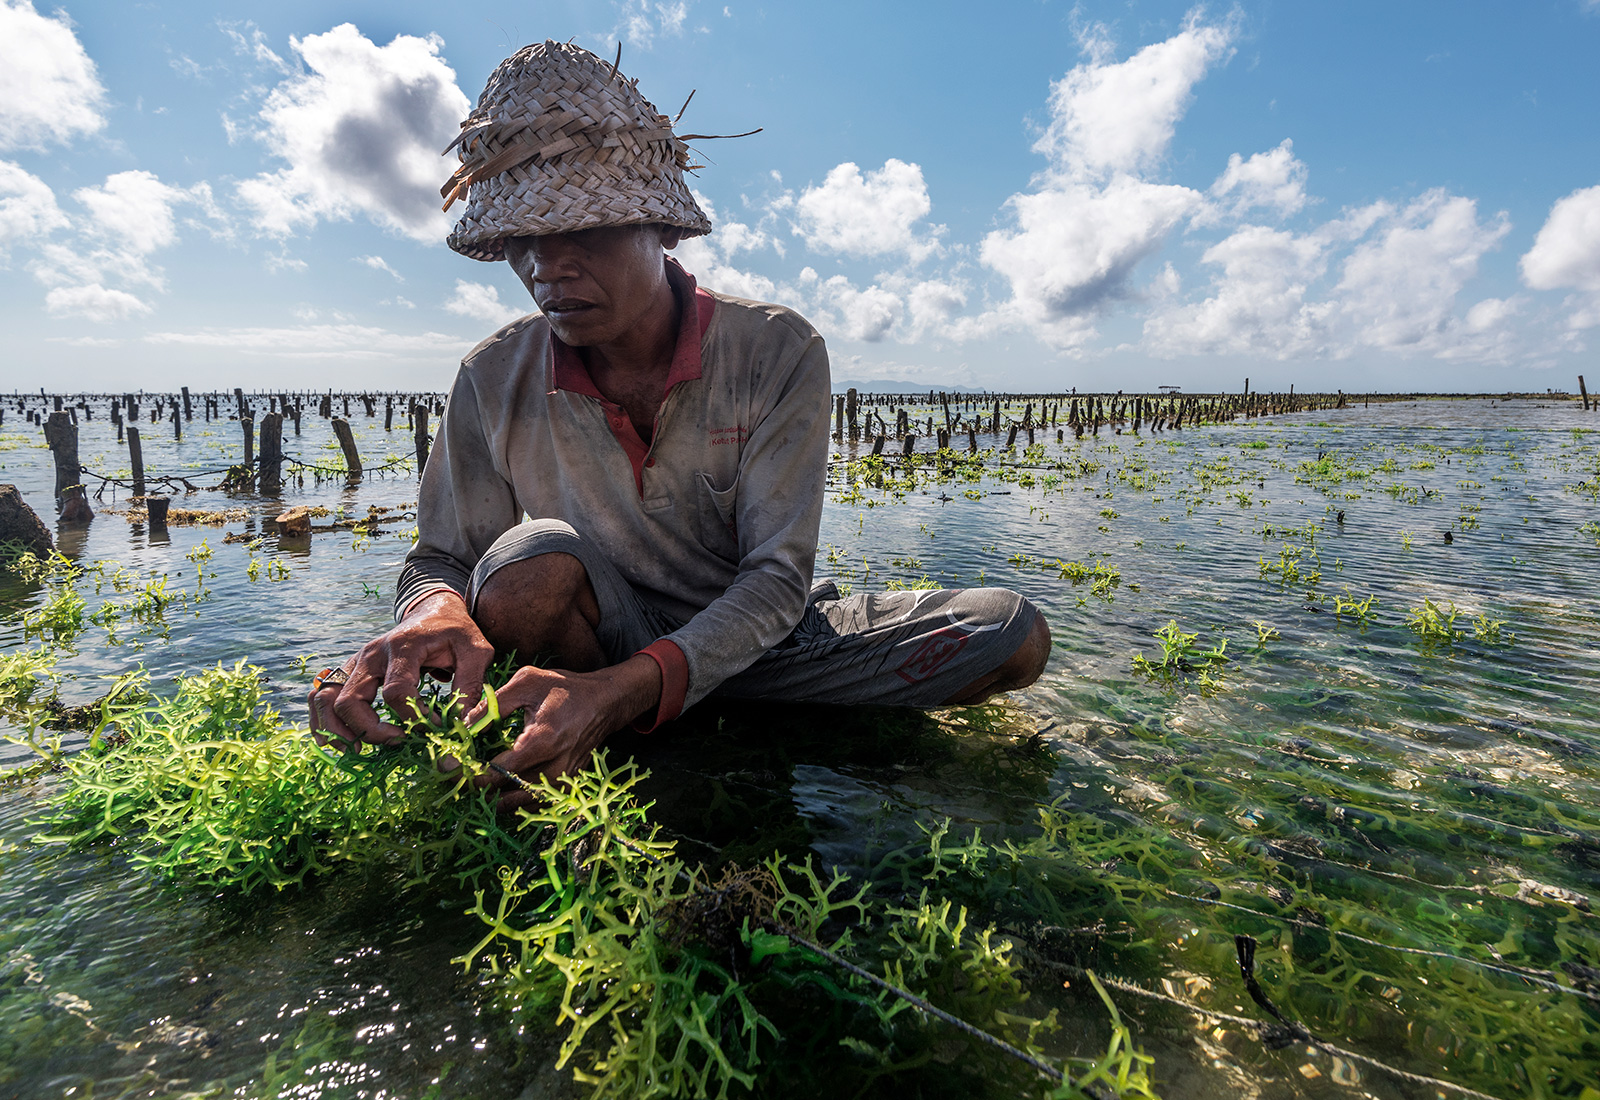
Seaweed farmer, Indonesia. Photo: PRADEEP87 / iStock
Evidence suggests that marine habitats and biodiversity are showing rapid ongoing declines, as humans have significantly altered two-thirds of the ocean (up from 40 percent in 2008).3 A seminal global report called this rate of decline “unprecedented” and pointed to species extinctions as accelerating.
According to the most recent assessment from the Intergovernmental Science-Policy Platform on Biodiversity and Ecosystem Services (IPBES), approximately one million plant and animal species (including marine and terrestrial combined) are threatened by extinction, many within decades.4 The current rate of extinction is tens to hundreds of times higher than the average over the past 10 million years, and it is accelerating.5 The scale of these human-driven impacts have led to the naming of a new geological epoch—the Anthropocene—in which human activity is the dominant influence on the climate and environment.
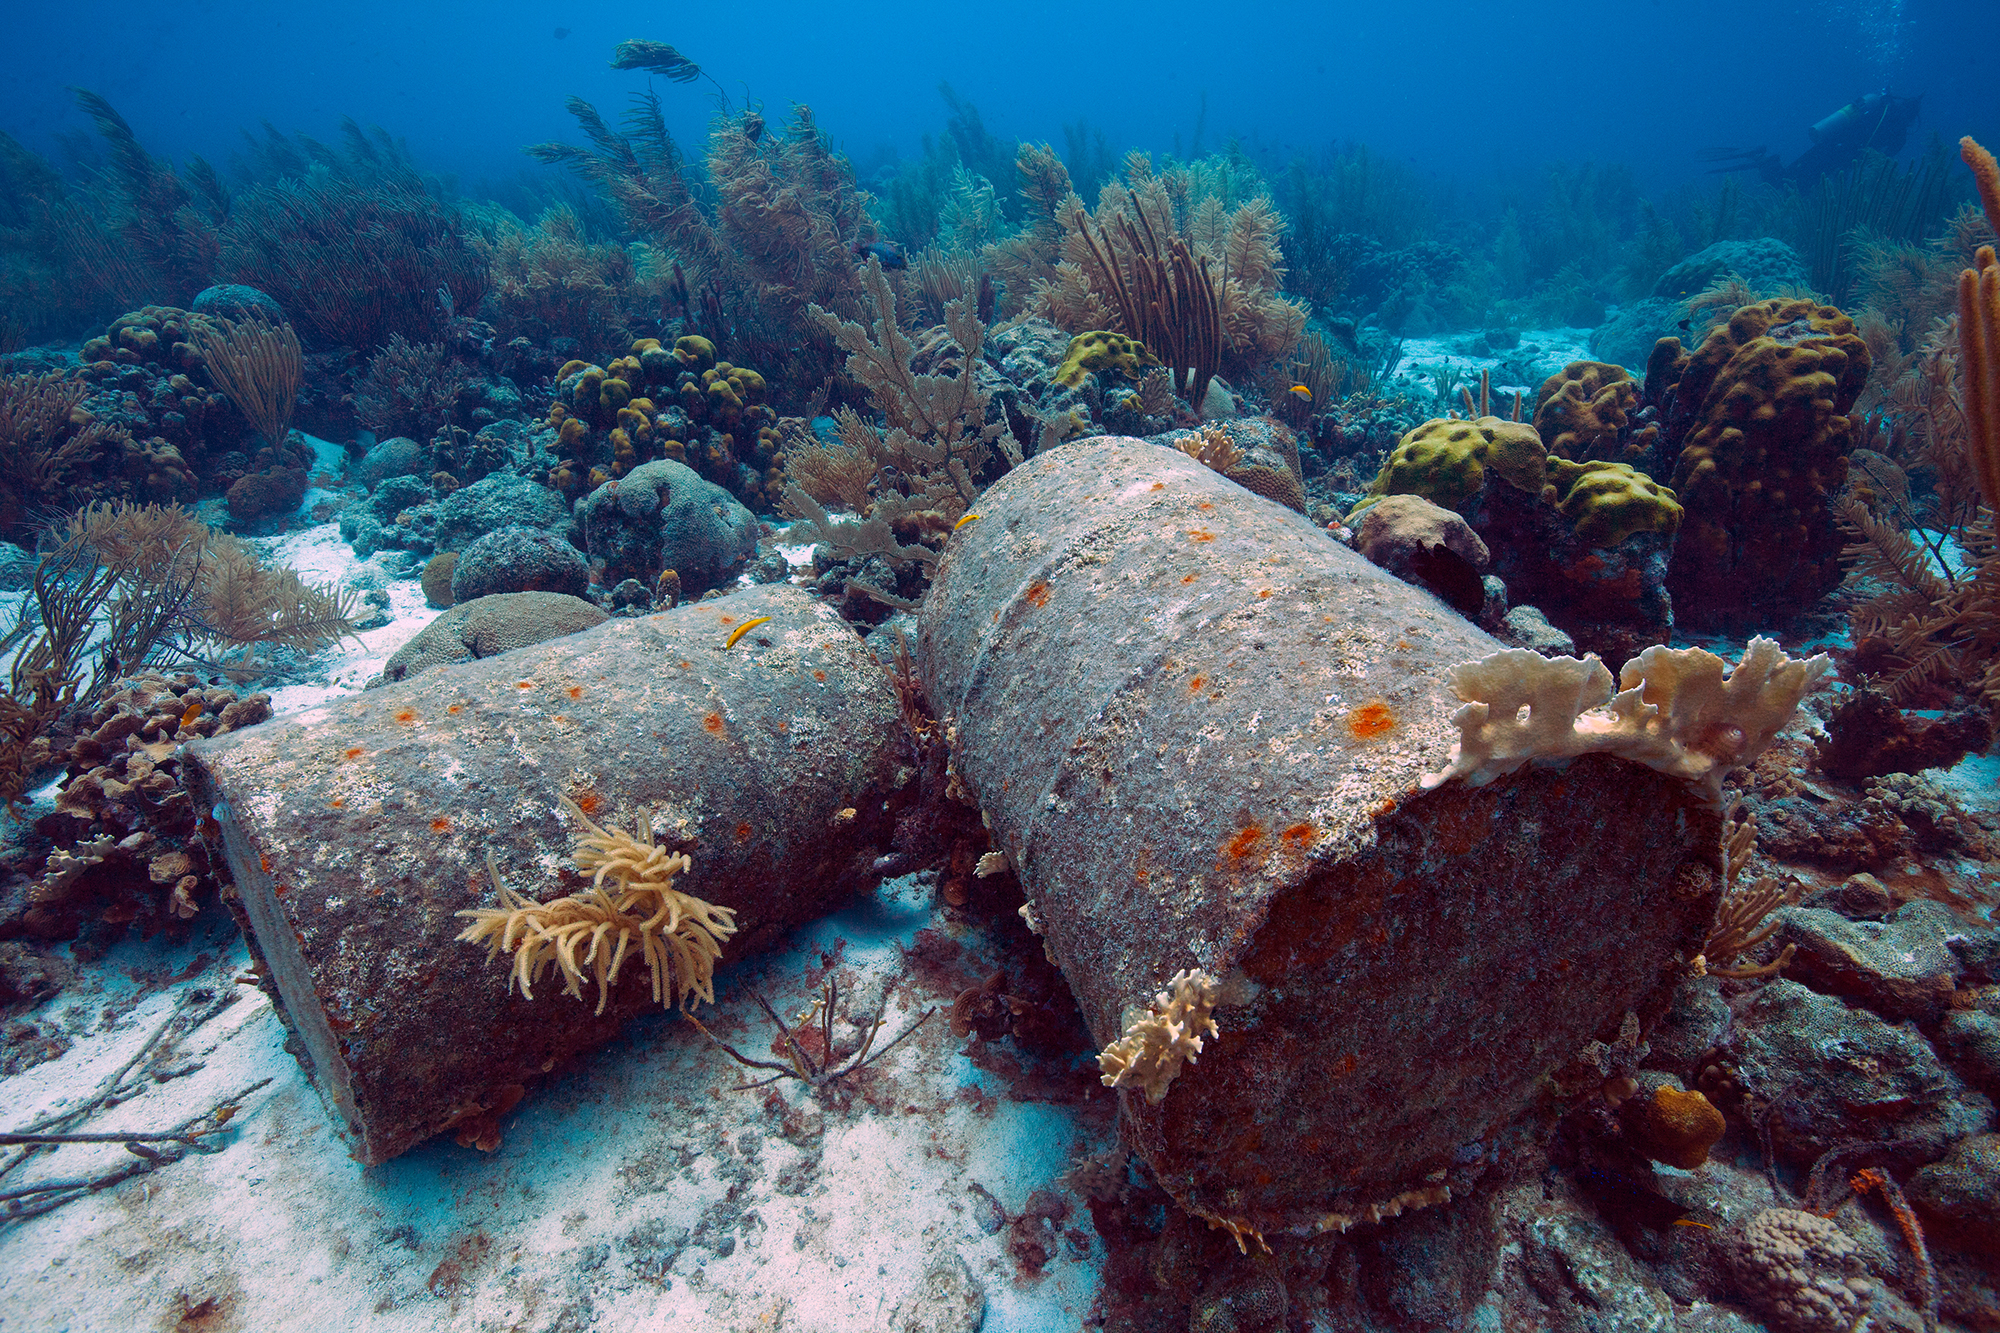
Photo: Jill Heinerth / Ocean Image Bank
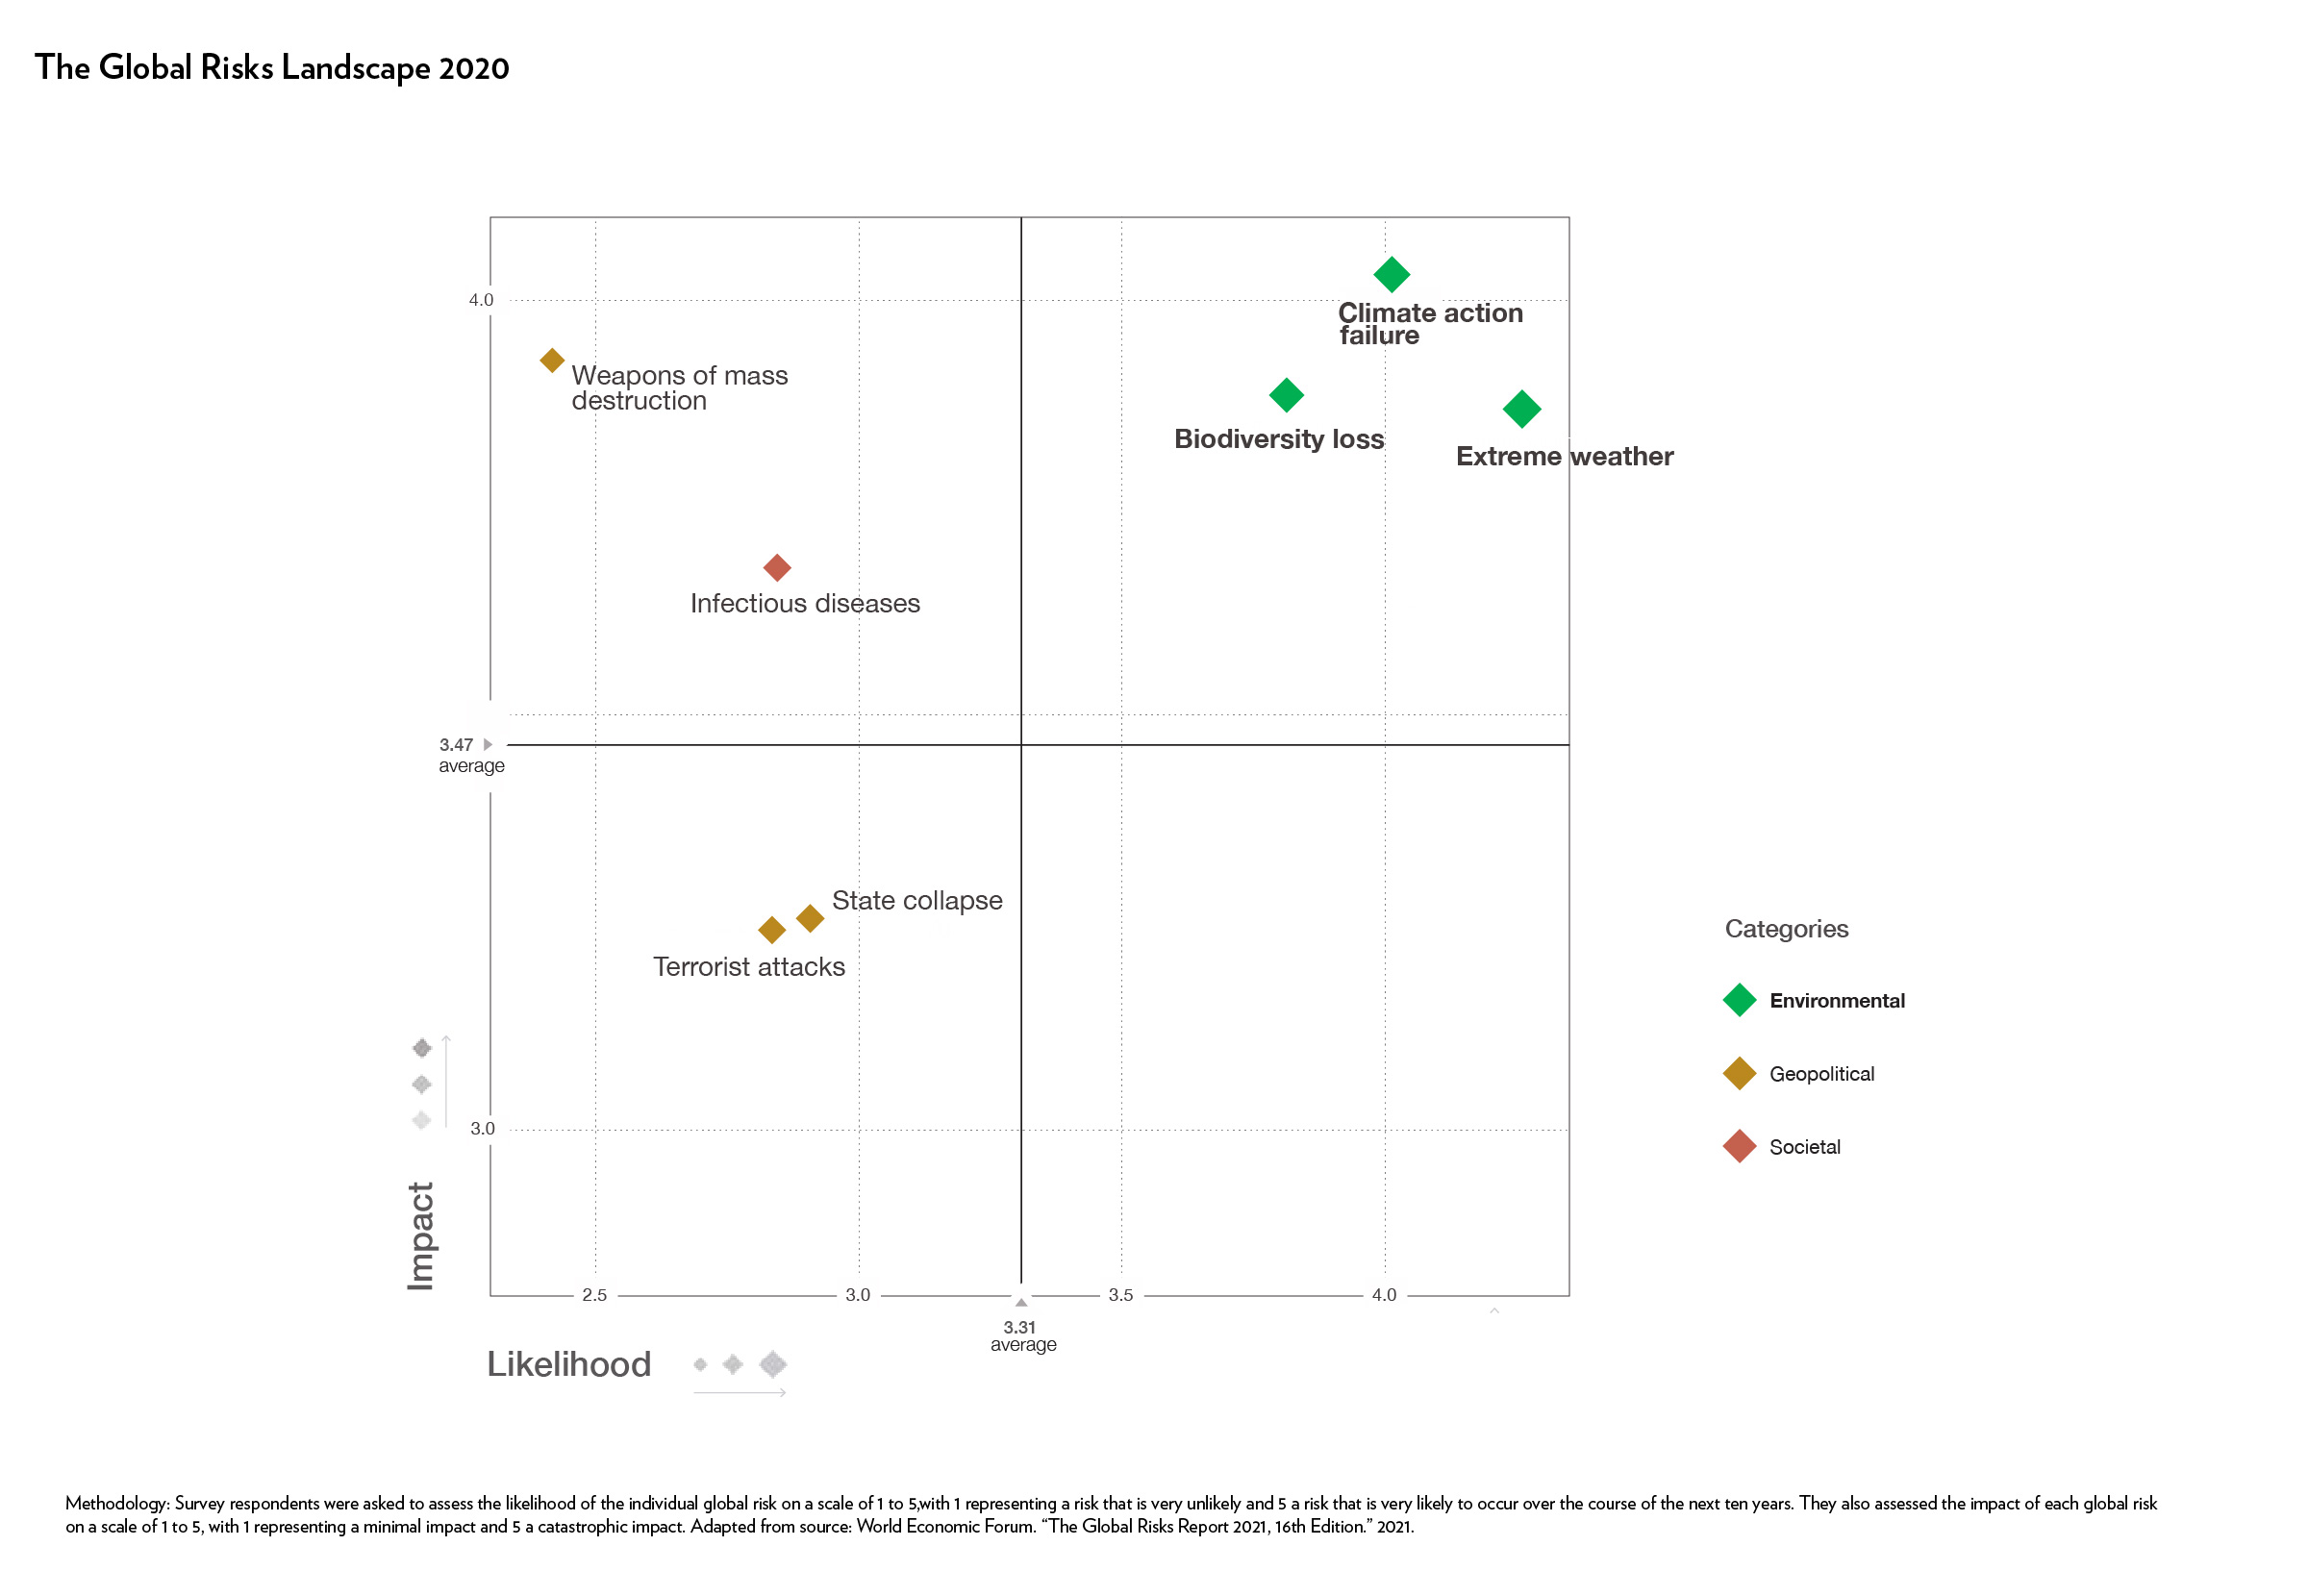
According to the World Economic Forum’s most recent Global Risks Report, the scale and pace of biodiversity decline due to human activity makes it one of the top five risks over the next decade—ahead of risks such as state collapse, terrorists attacks, and geophysical disasters.6 An estimated USD 44 trillion of economic value generation, more than half of the world’s total GDP, is moderately or highly dependent on nature and its services.7
The Global Risks Landscape 2021
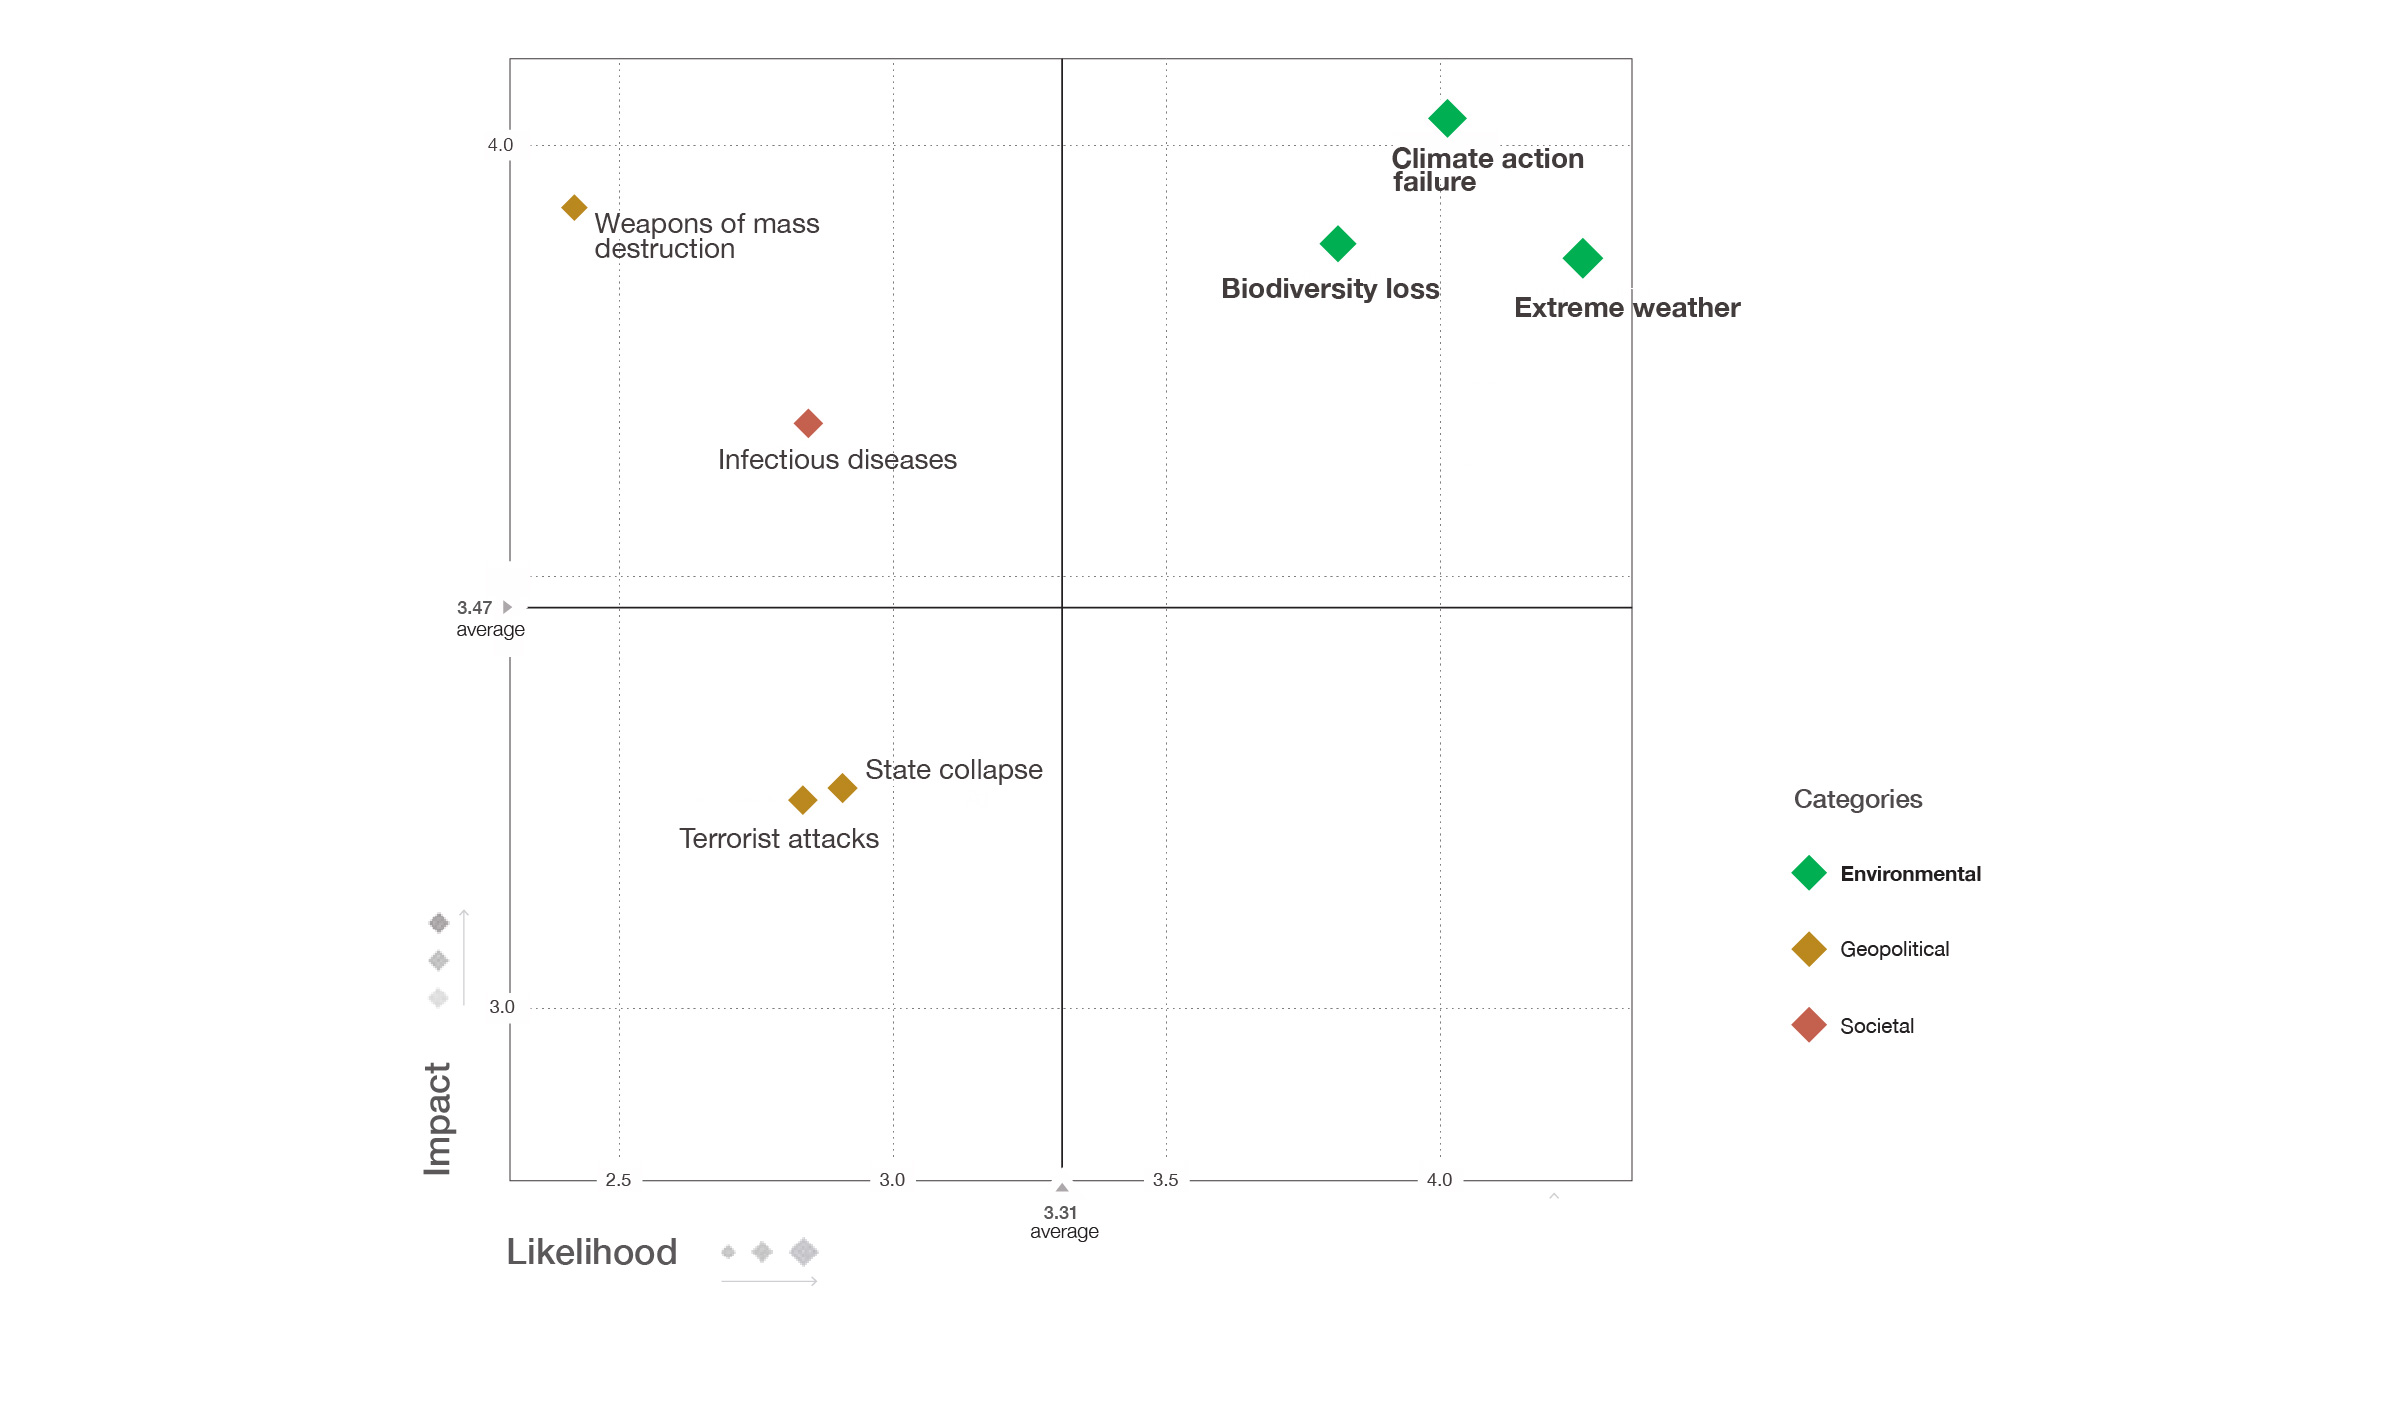
Methodology: Survey respondents were asked to assess the likelihood of the individual global risk on a scale of 1 to 5,with 1 representing a risk that is very unlikely and 5 a risk that is very likely to occur over the course of the next ten years. They also assessed the impact of each global risk on a scale of 1 to 5, with 1 representing a minimal impact and 5 a catastrophic impact. Source: World Economic Forum. “The Global Risks Report 2021, 16th Edition.” 2021.
WEF Global Risks Landscape lists
Top 10 risks in terms of Likelihood:
- Extreme weather
- Climate action failure
- Natural disasters
- Biodiversity loss
- Human-made environmental disasters
- Data Fraud or theft
- Cyberattacks
- Water crisis
- Global governance failure
- Asset bubbles
Top 10 risks in terms of Impact:
- Climate action failure
- Weapons of mass destruction
- Biodiversity loss
- Extreme weather
- Water crisis
- Information infrastructure breakdown
- Natural disasters
- Cyberattacks
- Human-made environmental disasters
- Infectious diseases
Source: World Economic Forum Global Risks Perception Study 2019–2020.
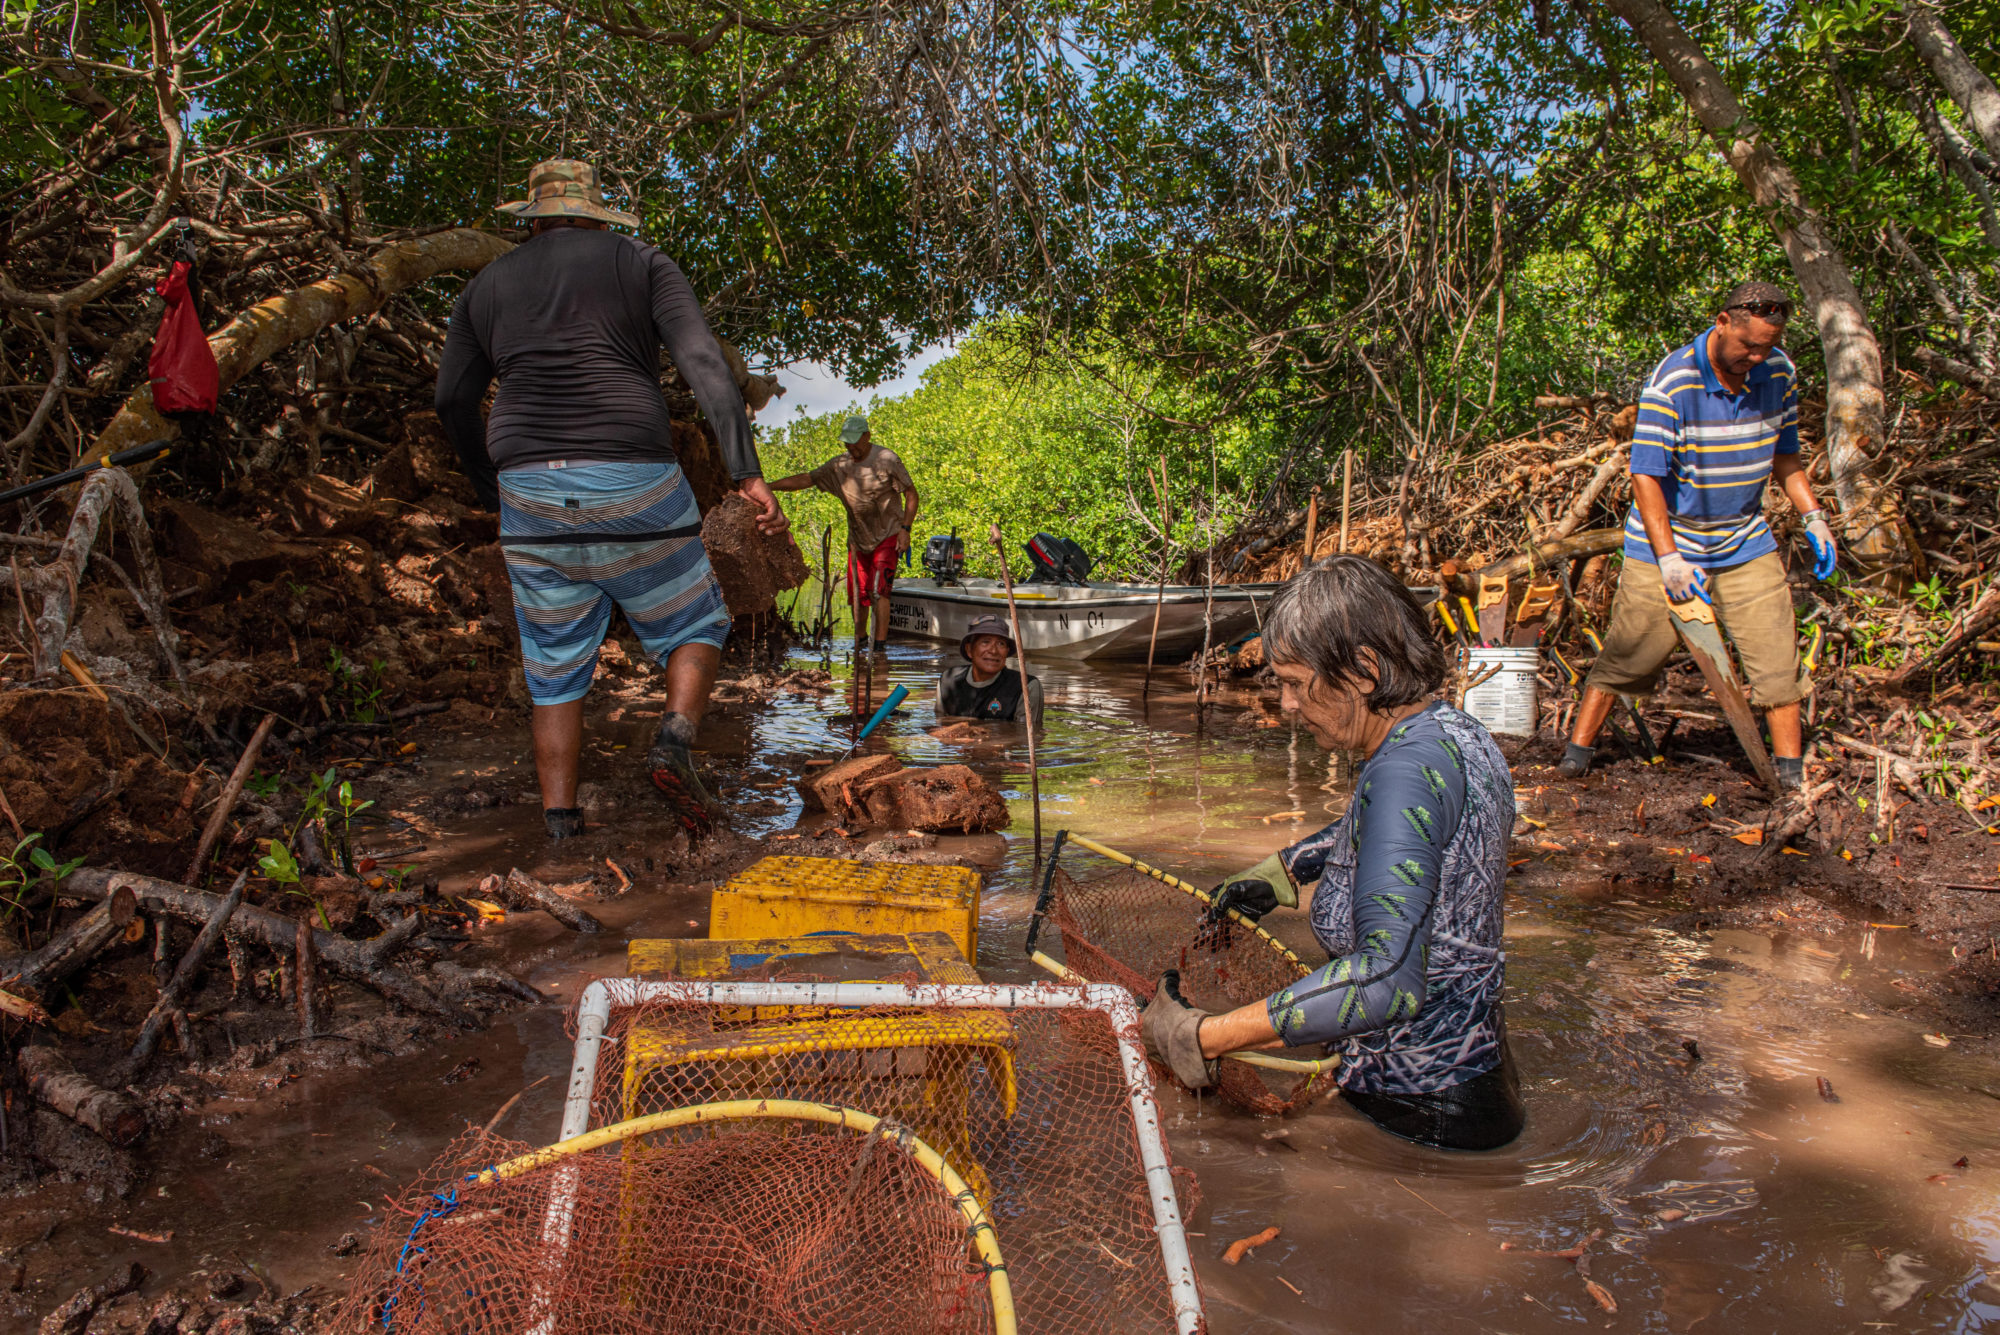
Volunteers working in the mangroves, Lac Bay, Bonaire. Credit: Lorenzo Mittiga / Ocean Image Bank
Human pressures are driving the unprecedented decline of marine habitats and biodiversity throughout the global ocean. The primary drivers of biodiversity loss include habitat destruction, overexploitation, land-based development and pollution, and increasingly, climate change and ocean acidification.8
Recent research identified anthropogenic stressors to marine biodiversity as “extensive, expanding, and intensifying.”9 Among marine species threatened with extinction according to the IUCN Red List, the most common anthropogenic threats are habitat modification and overexploitation.10 However, sensitivity to these stressors tends to vary significantly by both species and taxonomic group. In national waters, fishing activity tends to dominate the footprint of human impacts, whereas climate-related stressors tend to drive the expansion and intensification of impacts.11
Relative importance of anthropogenic stressors to marine species threatened with extinction
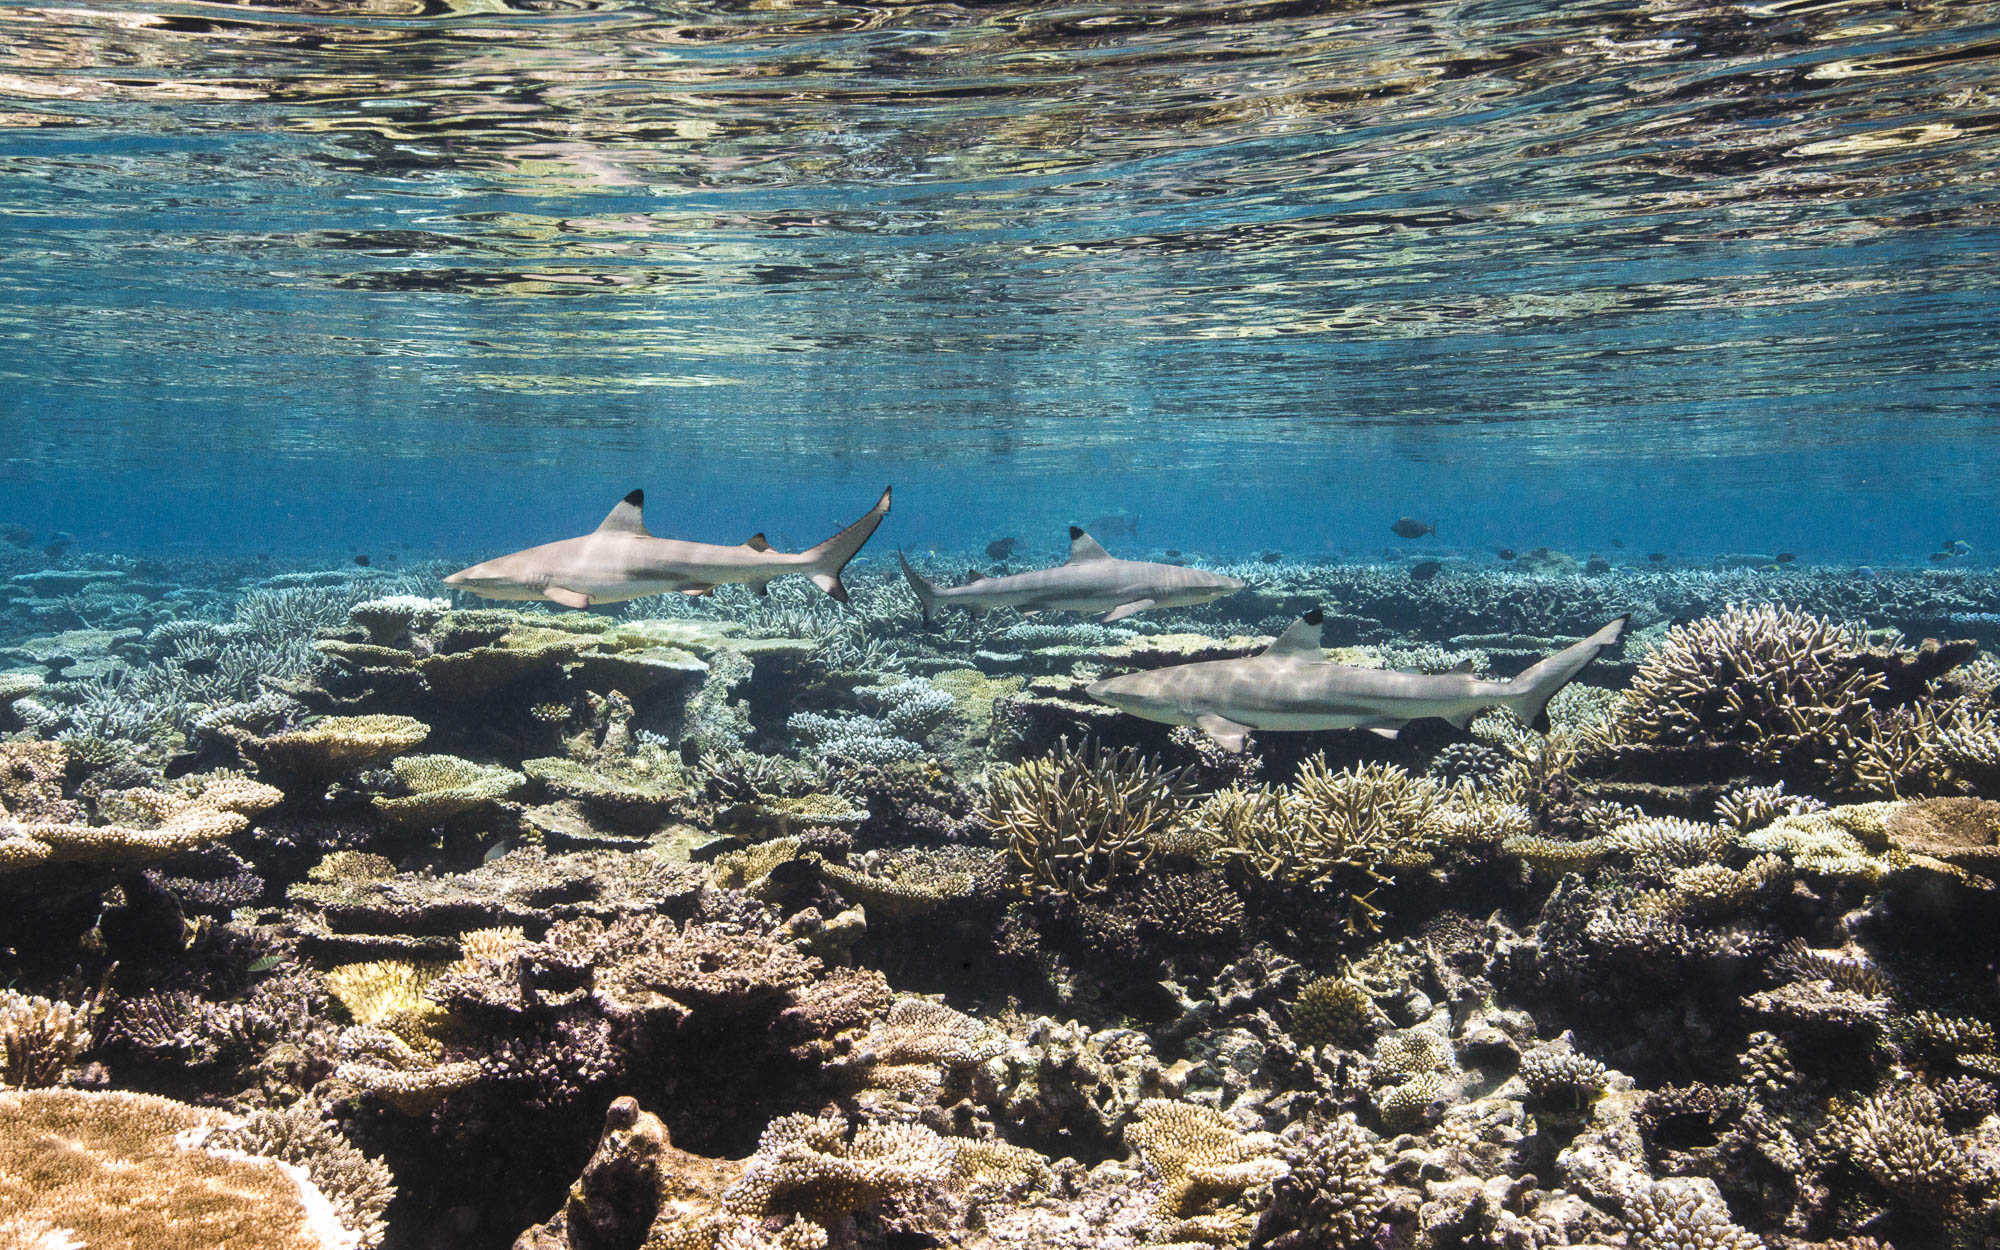
The sensitivity to anthropogenic stressors varies by species and taxonomic group. For instance, threatened corals and sea anemones (anthozoan species) experience the highest average number of threats—from overfishing, coastal development, agricultural runoff, and increasingly, climate change and ocean acidification.12 Threatened sharks, rays, and chimeras (chondrichthyans) experience a lower average number of threats, but the impacts of overexploitation are particularly acute for these marine species.
Average number of stressors affecting species threatened with extinction
The distribution and impact of anthropogenic stressors to threatened marine species also varies by geography. Among marine species threatened with extinction, species in the Atlantic and Mediterranean are most impacted by overexploitation.13 In the East Indian and Central Pacific basins, the most significant stressor is habitat destruction and modification.14 In the Arctic, threatened marine species are most impacted by habitat destruction, related to large-scale habitat alterations due to changes in sea ice extent. Given the variation and distribution of anthropogenic stressors by marine species, taxonomic group, and geographic region, conservation practitioners and managers can use this information to develop solutions to mitigate stressors using targeted approaches.
Distribution of anthropogenic stressors faced by marine species threatened with extinction
Estimating the loss of marine biodiversity and habitat is as much about what we do not know as what we do know. It is estimated that only 10–25 percent of marine species have been described globally.15 The lack of baseline data and long-term monitoring also remains a challenge in tracking the status of both species and habitats.
Among the least known groups, there could be thousands to over a hundred thousand undescribed species.16 Within the IUCN Red List to assess extinction risk, only about 3 percent of roughly 240,000 described marine species have been assessed. Of the IUCN-assessed marine species, 11 percent are considered threatened with extinction.17 Research suggests that species loss often does not manifest as the complete extinction of individual species, but instead as changes in the composition of ecosystems and the relative abundance and ecological status of individual species, coupled with more regional or local extirpations.18 Even absent an assessment of global extinction, a species could have marked influence through ecological extinction, local extinction, or commercial extinction.
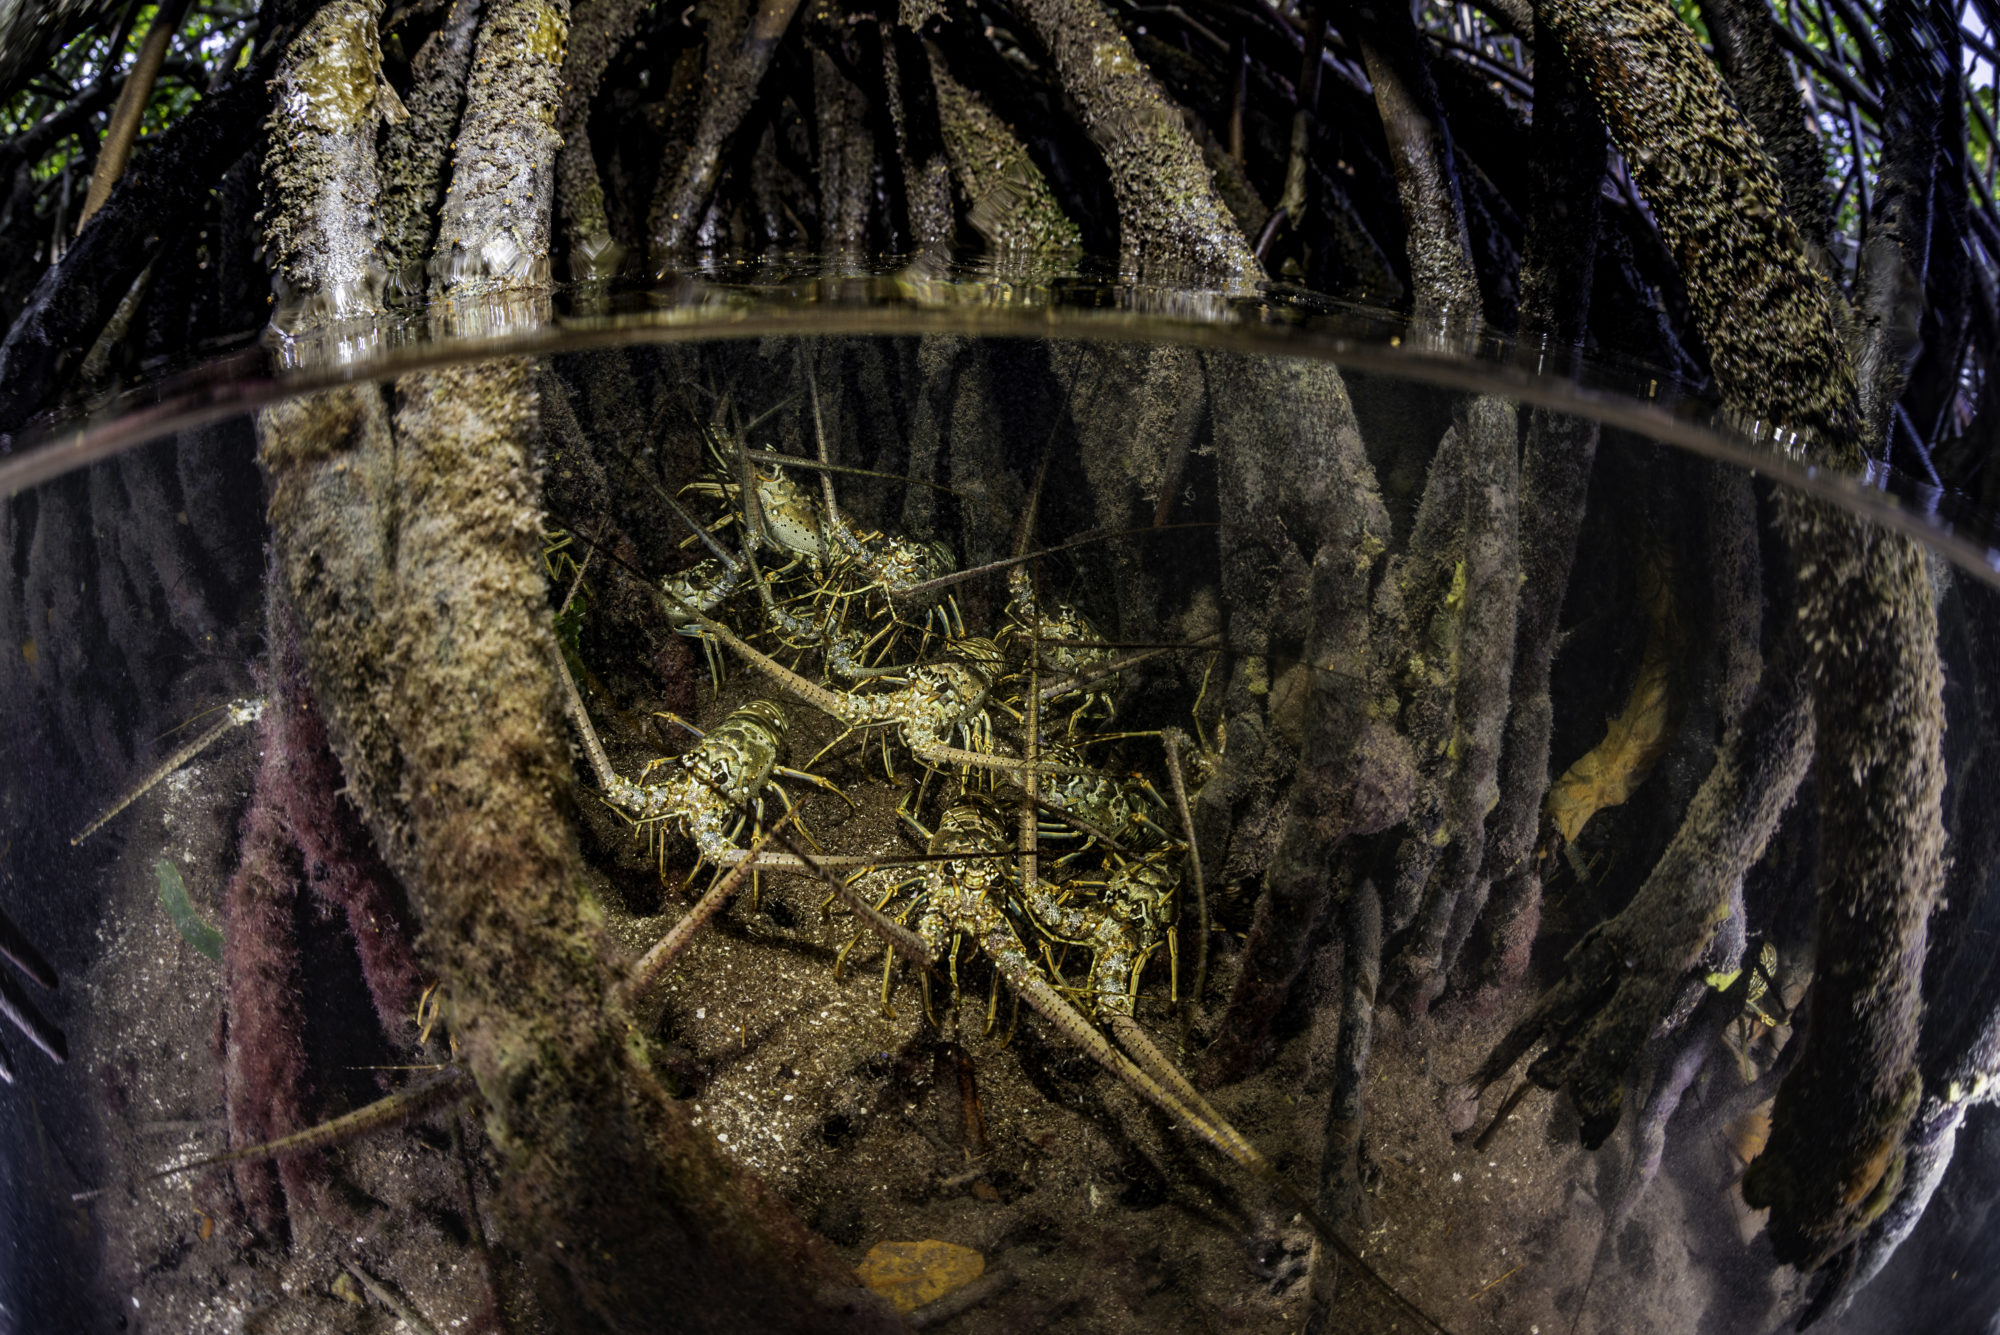
Juvenile lobsters in the mangroves, Lac Bay, Bonaire. Credit: Lorenzo Mittiga / Ocean Image Bank
Conservation status of IUCN-assessed marine species
A key challenge in understanding trends for marine biodiversity and ecosystem integrity include the lack of baseline data and long-term monitoring of the status of species and habitats.19 There has been a lack of global coordination to gather baseline data and support ongoing monitoring, in spite of recommendations to do so for the past several decades. While the IUCN Red List includes modest coverage of extinction risk assessments for marine vertebrates—including fish, seabirds, and marine mammals—there is inconsistent coverage in particular of marine invertebrates.20 As a result of this incomplete data picture, there are discrepancies and biases in understanding particular geographic areas, habitat distribution, species groups, and performance trends.
The two taxonomic groups with the highest proportion of marine species threatened with extinction include actinopterygii (bony fishes) and anthozoa (corals and sea anemones).21 Although some suggest that extinction rates for marine species are lower than terrestrial species, evidence indicates that this may not be the case for two reasons. First, marine and terrestrial extinctions may not be directly comparable, and second, significant portions of the marine realm are under-sampled, which means that estimates of marine extinction rates are likely an underestimate.22
Taxonomic distribution of marine species threatened with extinction
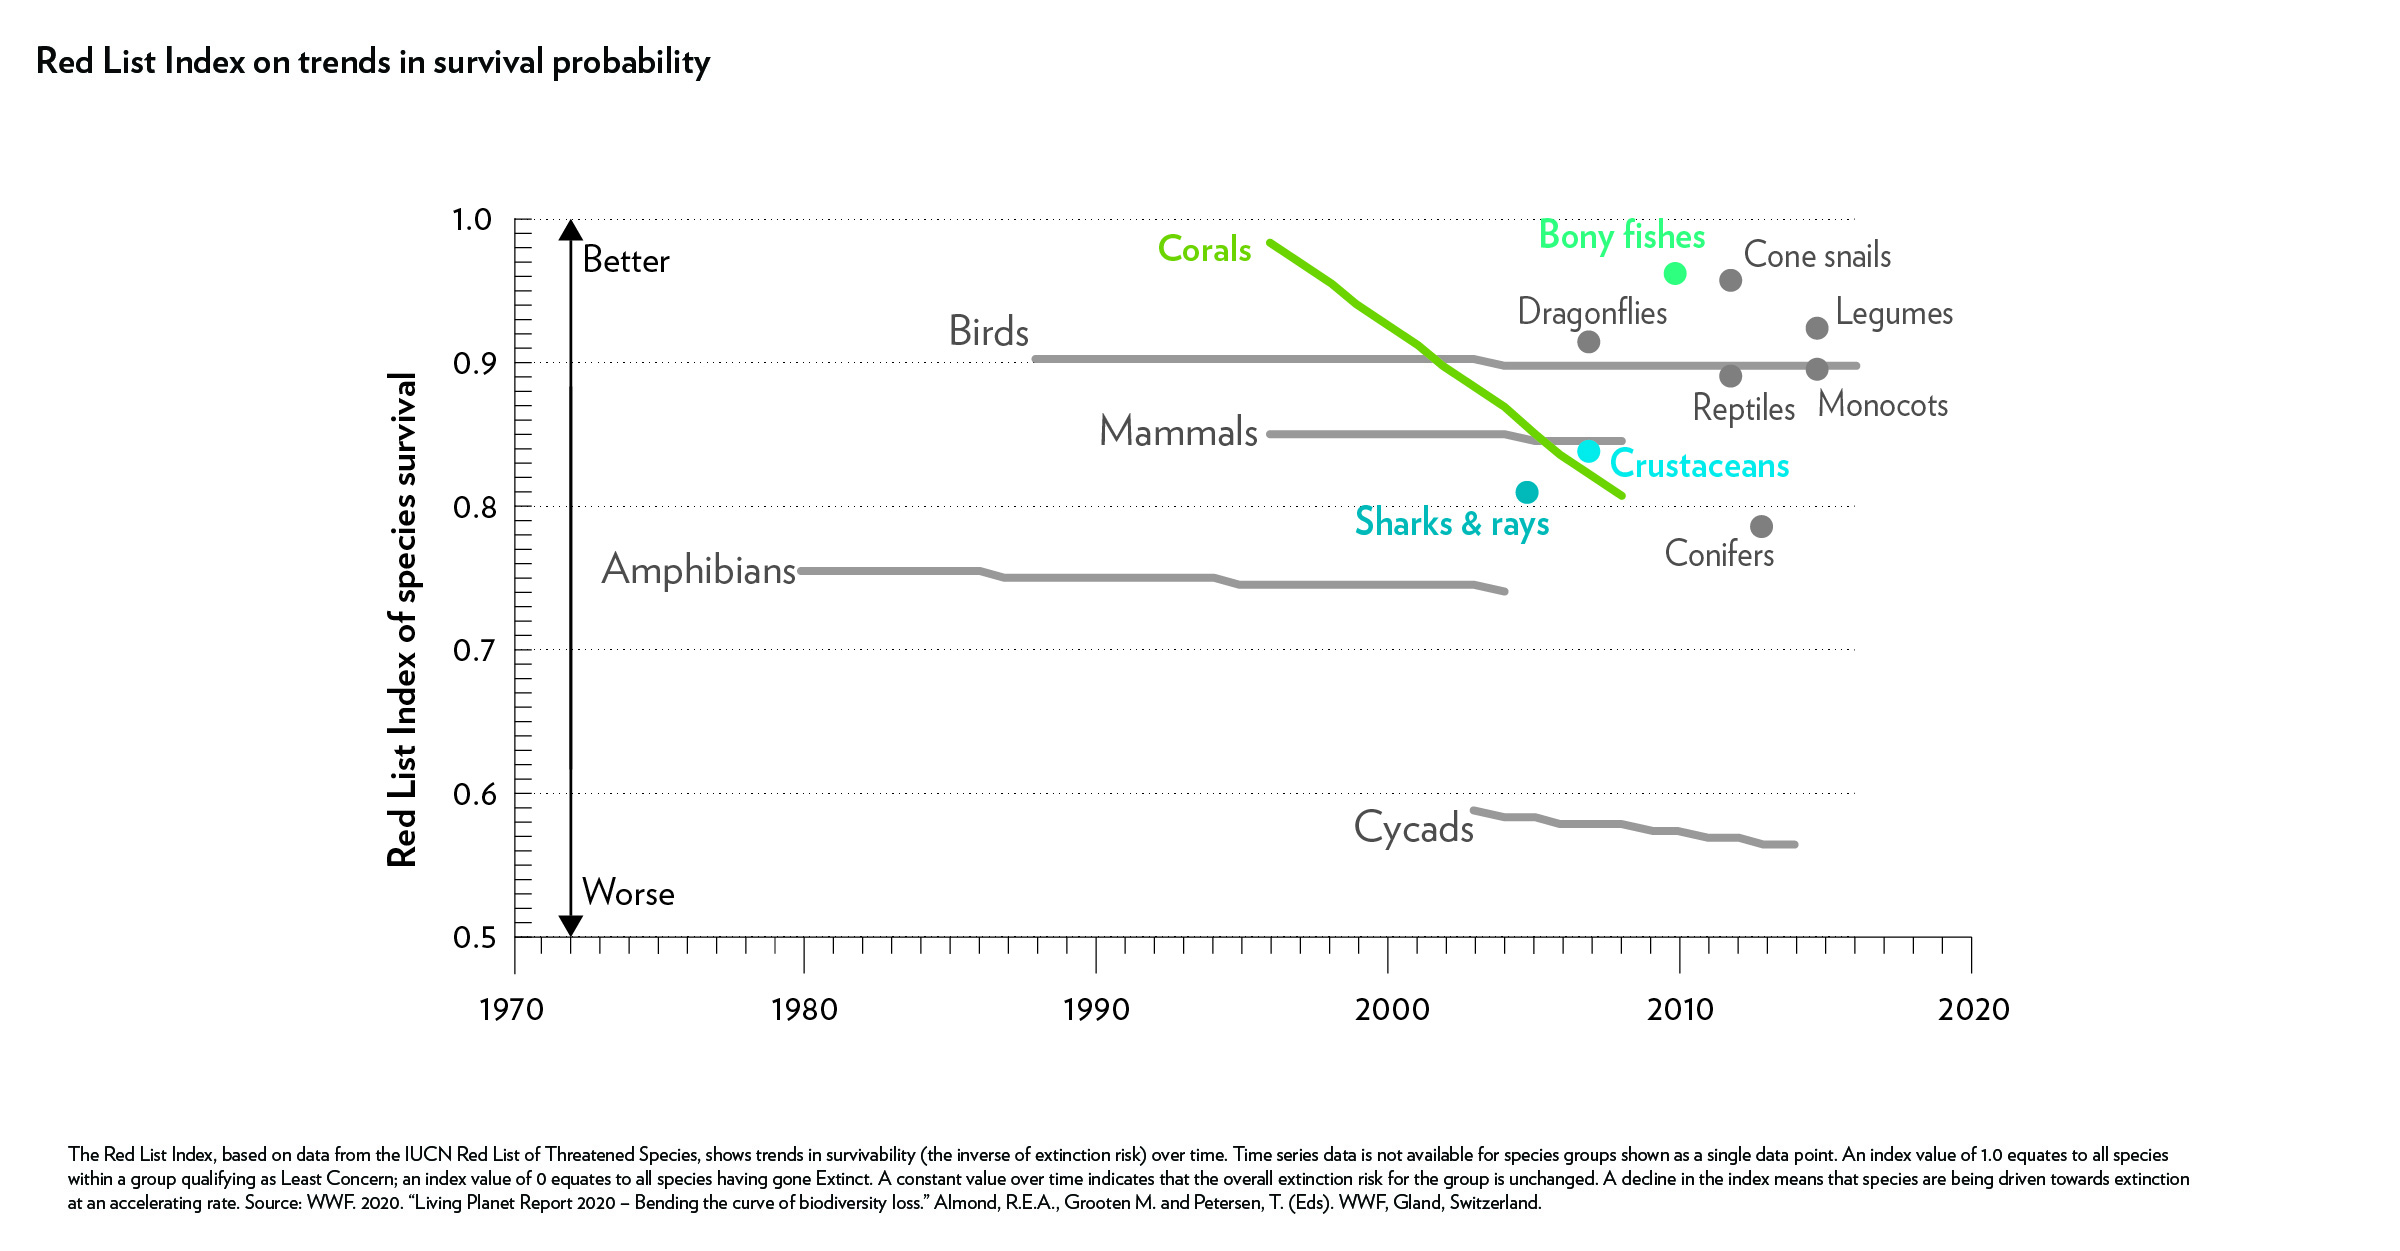
Red List Index on trends in survival probability
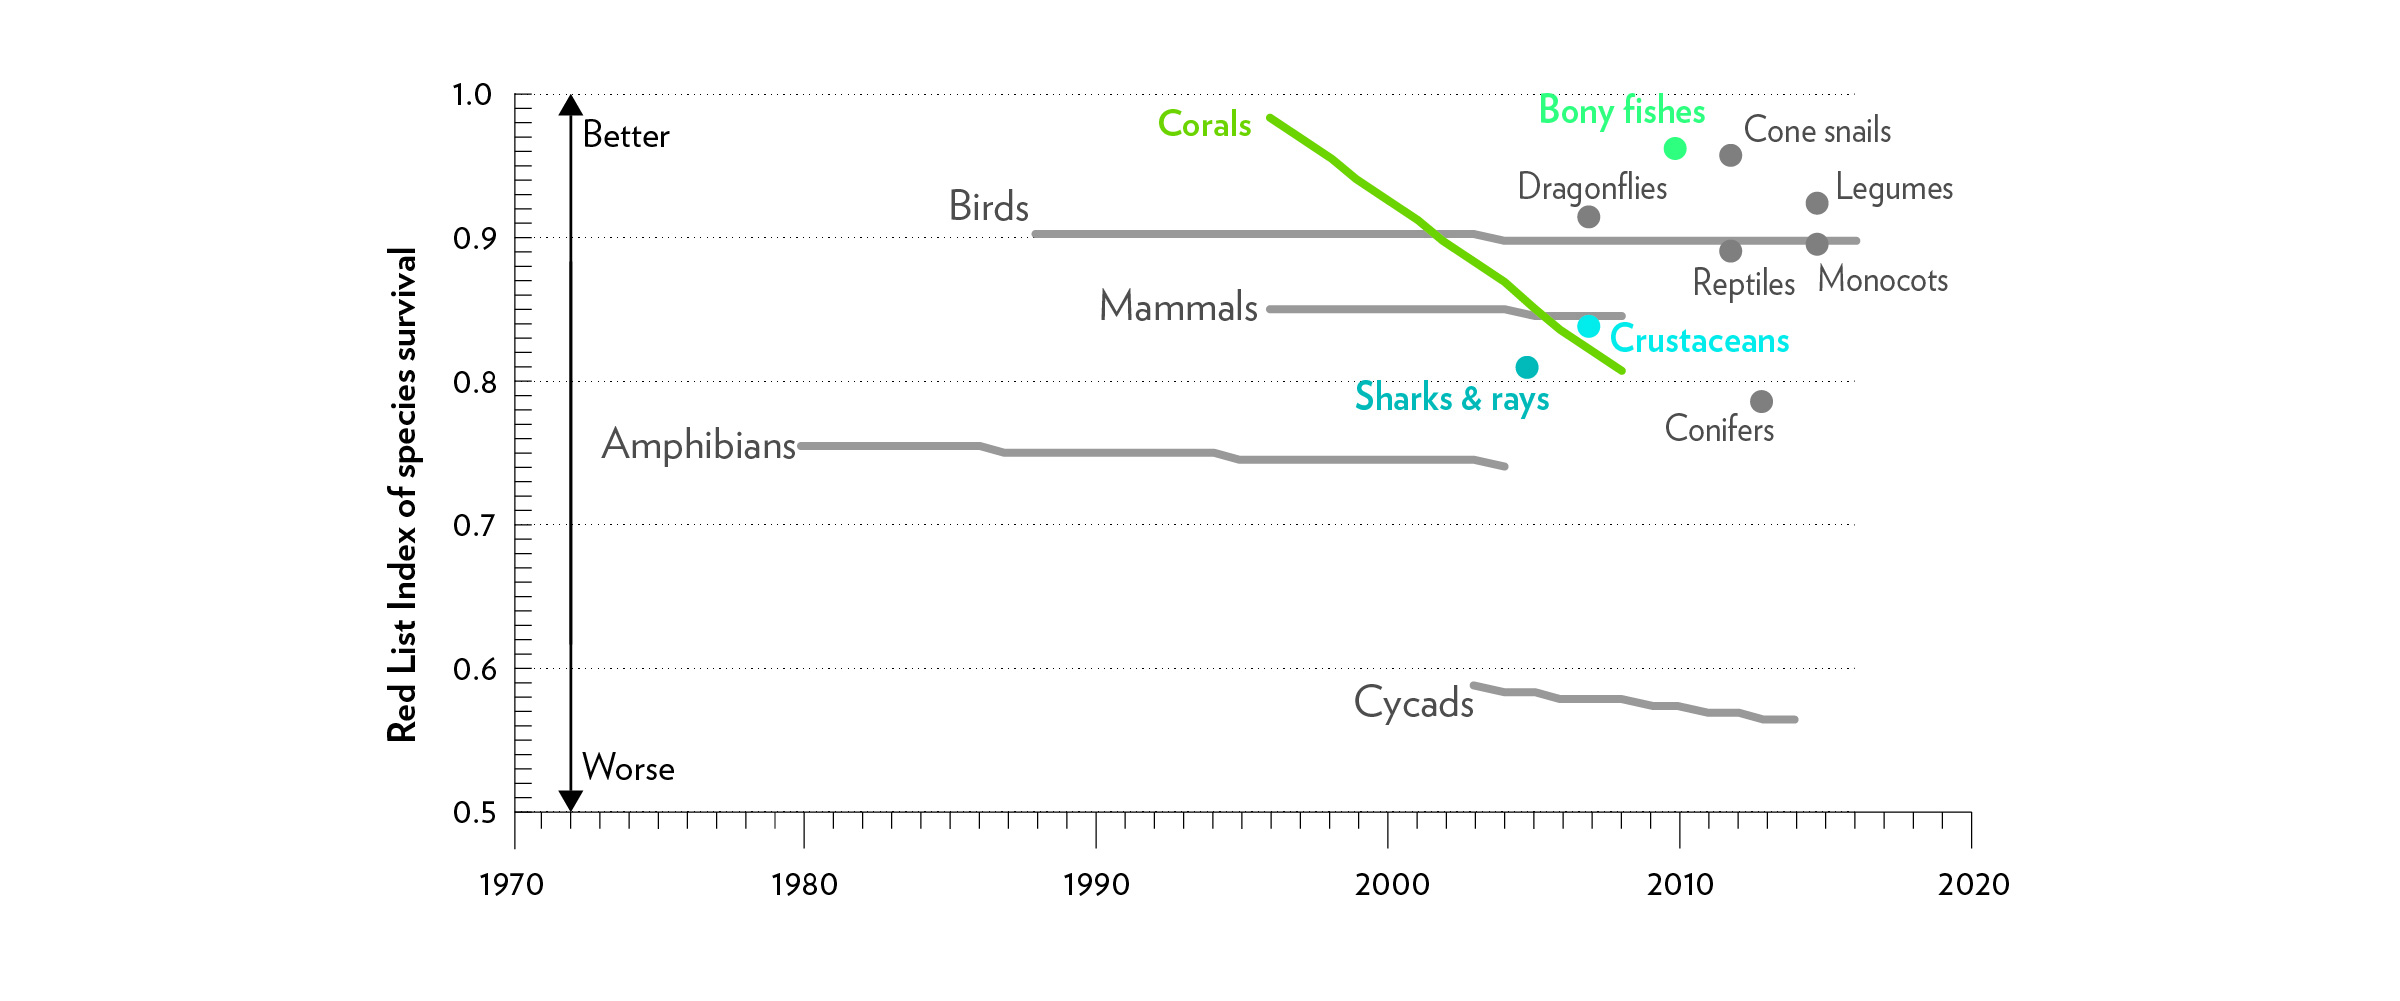
The Red List Index, based on data from the IUCN Red List of Threatened Species, shows trends in survivability (the inverse of extinction risk) over time. Time series data is not available for species groups shown as a single data point. An index value of 1.0 equates to all species within a group qualifying as Least Concern; an index value of 0 equates to all species having gone Extinct. A constant value over time indicates that the overall extinction risk for the group is unchanged. A decline in the index means that species are being driven towards extinction at an accelerating rate. Source: WWF. 2020. “Living Planet Report 2020 – Bending the curve of biodiversity loss.” Almond, R.E.A., Grooten M. and Petersen, T. (Eds). WWF, Gland, Switzerland.
Among marine habitats, an estimated 30-50 percent of vulnerable marine habitats have been lost, with patterns of loss accelerating in recent decades.23 The degradation and loss of marine habitats are not uniformly distributed and tend to have cumulative, yet poorly understood, interactions between multiple threats.24, 25
The IPBES assessment26 and other studies have found that marine habitats have changed in the following ways in recent years:
- Over 66 percent of the ocean experienced increasing cumulative impacts in 2014 (up from 40 percent in 2008).
- The extent of coral reefs has nearly halved since the 1870s, with the rate of decline most pronounced over the past 20–30 years.27 Projections for coral reef loss are particularly dire: in the absence of significant reductions in emissions, it is anticipated that a majority (70–99 percent) of corals on Earth may die off in the coming decades due to rising temperatures.28
- Seagrass meadows decreased in extent by over 10 percent per decade from 1970 to 2000.
- Global coverage of mangroves has declined by roughly 40 percent, while saltmarsh coverage has declined an estimated 60 percent.
- Kelp forests have shown significant declines in certain regions, including in the Great Southern Reef of Australia. Global patterns are more nuanced as kelp forests are declining in some areas but expanding in others.
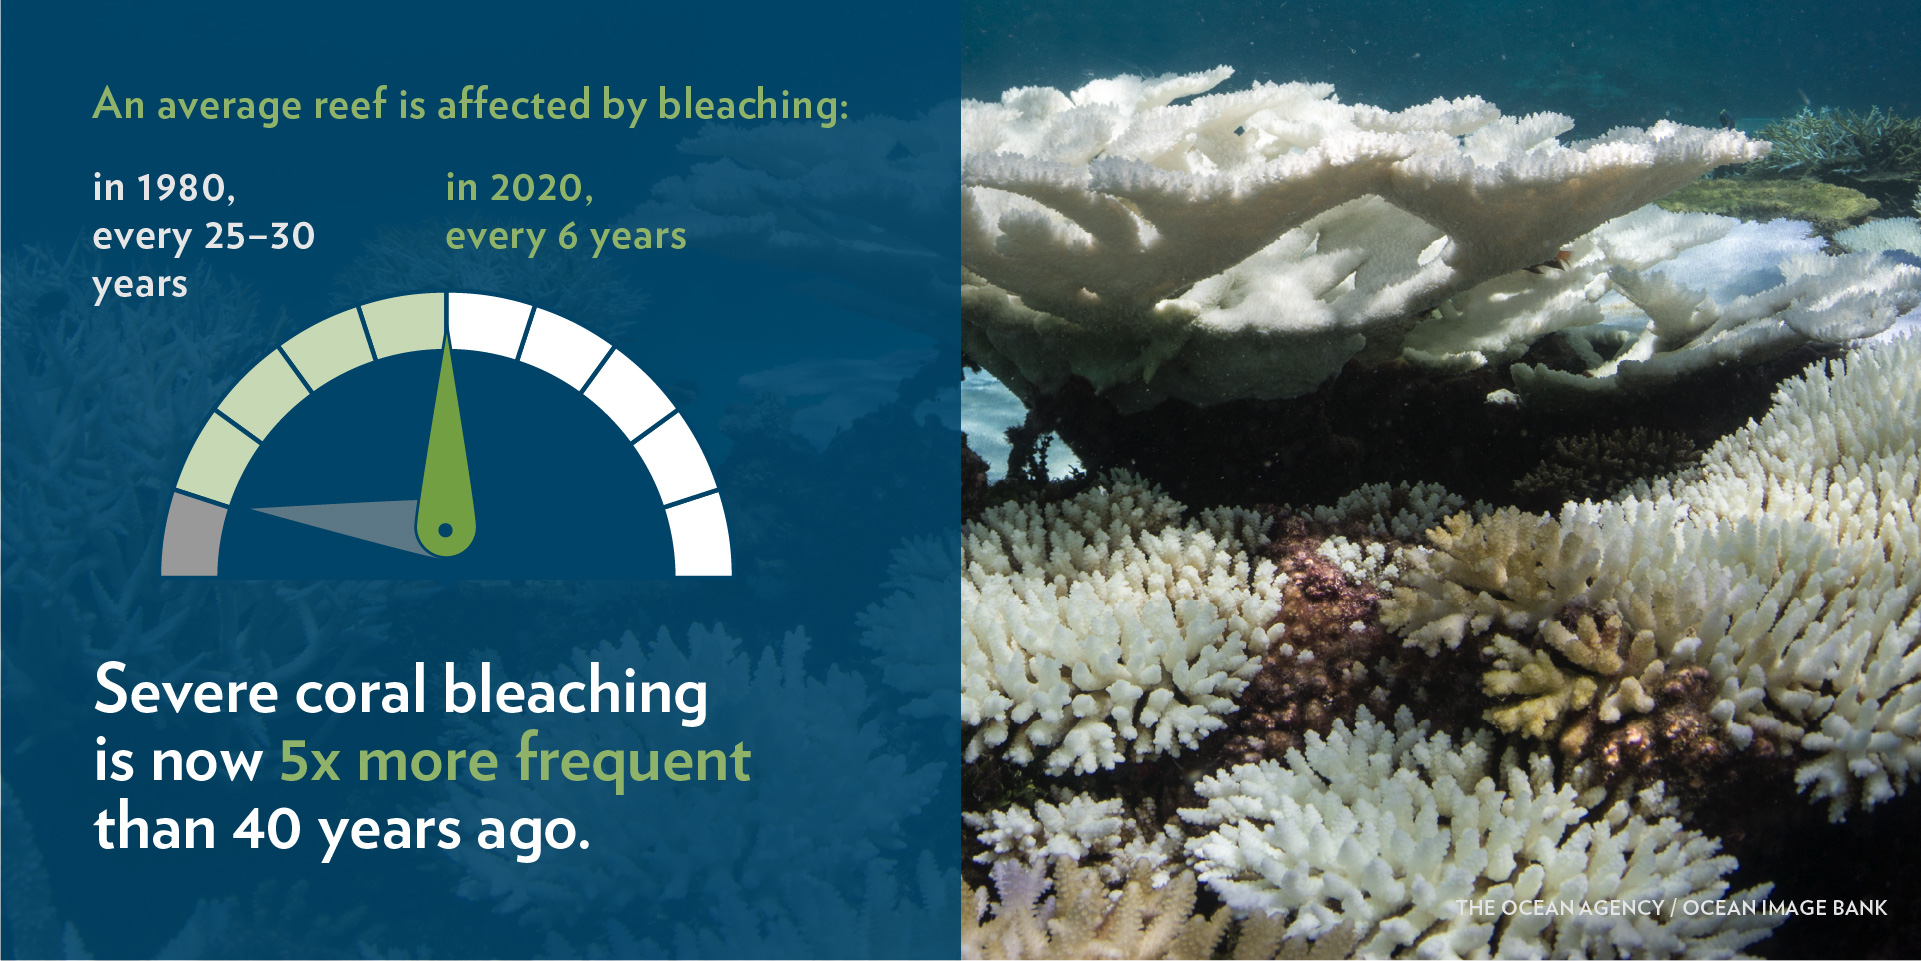
Coastal ecosystems—including coral reefs, seagrasses, and mangroves, have experienced the fastest pace of increase in cumulative human impact in recent years.29 Although coral reefs have long faced local stressors such as overfishing, industrial activity, and pollution, climate-related stressors (particularly increased sea surface temperature and ocean acidification) have presented an acute and intensifying risk in recent decades.
Mass coral reef bleaching events have become five times more common worldwide over the past 40 years, new research finds, with climate-related stressors playing a driving role in this change. The average reef was affected once every 25–30 years in the 1980s and once every six years in 2016.30
The expanding footprint of human development in the coastal zone has been evident in the loss of mangrove forests worldwide. At least 35 percent of mangrove area was lost globally during the 1980s and 1990s alone; in some regions, the rate of loss was as high as 50-80 percent. However, the rate of global mangrove deforestation has declined significantly in recent years. During 2000–2016, the average rate of loss for mangrove area was 0.13 percent.31
Historically, the most significant mangrove loss has occurred in Southeast Asia. Six countries—Indonesia, Myanmar, Malaysia, the Philippines, Thailand, and Vietnam—account for the vast majority of total global direct anthropogenic loss in mangrove extent.32 New research which provides the first mangrove-specific land use change model suggests that the area of mangroves converted by direct human activities declined by 73 percent from 2000 to 2016.33
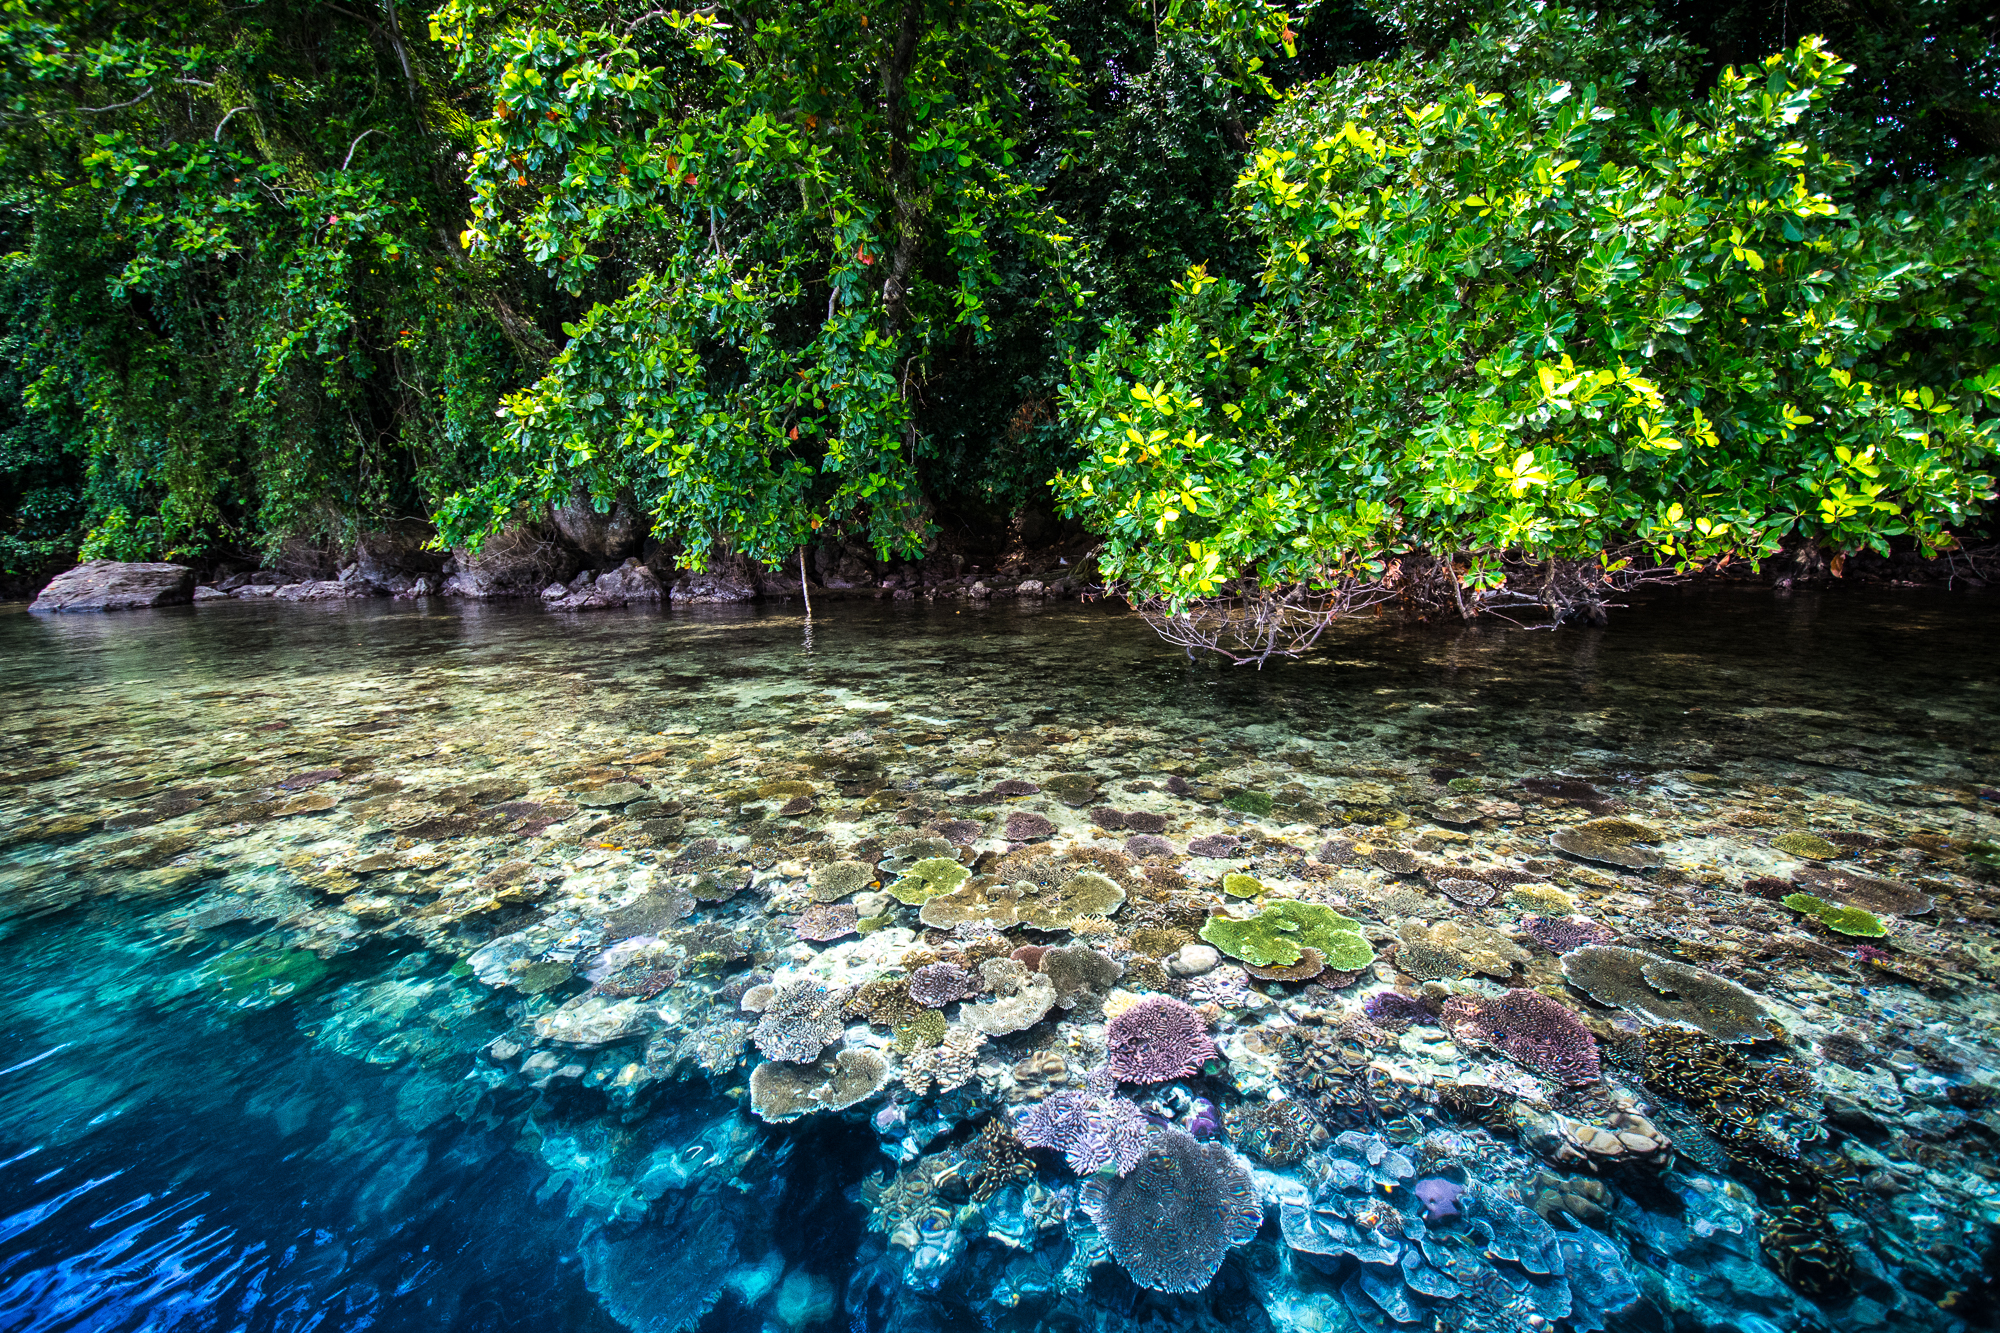
Mangroves and coral, Kimbe Bay, Papua New Ginea. Photo: Matt Curnock / Ocean Image Bank
Mangrove loss by driver (km)
The top five countries with the largest net loss in mangrove extent in recent years include Indonesia, Mexico, Brazil, Myanmar, and Australia.35
Top 10 countries with largest net loss in mangrove extent
In the past decade, there has been significant progress in expanding a network of marine protected areas (MPAs). In 2000, less than 0.9 percent of the ocean was protected. As of mid-2021, roughly 8.4 of the ocean was protected (in implemented and unimplemented MPAs).36
To address losses in biodiversity and marine habitat, the international community has increasingly focused on the protection of marine areas and the mitigation of both local and global threats. For several decades, MPA coverage hovered around 1 percent. The rate of MPA designations increased rapidly in recent years as governments raced to meet a global target of 10 percent ocean protection by 2020. Currently, 7 percent of the ocean is in designated MPAs and 1.4 percent is in proposed or committed MPAs—for a cumulative of 8.4 percent.37 When governments gather in October 2021 to develop a post-2020 global framework for biodiversity at the Conference of the Parties 15 (COP15), they will discuss whether to approve a proposed target to protect at least 30 percent of the ocean by 2030.
Many suggest that there is an emerging need to bring climate and biodiversity under a shared global agenda, with MPAs as one important tool in a portfolio approach. In the Global Biodiversity Outlook 5, the Secretariat of the Convention on Biological Diversity observed that, “Many of the measures that are required to tackle poverty, reduce hunger, tackle climate change and reduce the risk of future pandemics are also those that are needed to support biodiversity, so there is potential for a powerful shared agenda.”38
Gaafu Alifu Atoll, Maldives. Credit: Warren Baverstock / Ocean Image Bank
Solutions are at hand to address the threats of marine habitat and biodiversity loss. Read our Solutions Chapter to discover the landscape of practical interventions.
Notes
- IPBES. “IPBES Global Assessment Summary for Policymakers.” https://www.ipbes.net/news/ipbes-global-assessment-summary-policymakers-pdf. (2019).
- IPBES. “Workshop Report on Biodiversity and Pandemics of the Intergovernmental Platform on Biodiversity and Ecosystem Services.” Daszak, P., das Neves, C., Amuasi, J., Hayman, D., Kuiken, T., Roche, B., Zambrana-Torrelio, C., Buss, P., Dundarova, H., Feferholtz, Y., Foldvari, G., Igbinosa, E., Junglen, S., Liu, Q., Suzan, G., Uhart, M., Wannous, C., Woolaston, K., Mosig Reidl, P., O’Brien, K., Pascual, U., Stoett, P., Li, H., Ngo, H. T., IPBES secretariat, Bonn, Germany, DOI:10.5281/zenodo.4147317.
- IPBES. “IPBES Global Assessment Summary for Policymakers.” 2019.
- Ibid.
- Ibid.
- World Economic Forum. “The Global Risks Report 2021, 16th Edition.” 2021.
- World Economic Forum. “The Global Risks Report 2020, 15th Edition.” 2021.
- Rogers, A., O. Aburto-Oropeza, et al. 2020. “Critical Habitats and Biodiversity: Inventory, Thresholds and Governance.” Washington, DC: World Resources Institute. Available online at www.oceanpanel.org/blue-papers/critical-habitats-and-biodiversity-inventory-thresholds-and-governance.
- O’Hara et al. “At-risk marine biodiversity faces extensive, expanding, and intensifying human impacts.” Science 372, 84–87 (2021). 1 0.1126/science.abe6731.
- Luypaert, T. et al. In YOUMARES 9 – the oceans: our research, our future, edited by Jungblut, S., Liebich, V. and Bode-Dalby, M., 57-80, Switzerland: Springer, 2020.
- O’Hara et al. “At-risk marine biodiversity faces extensive, expanding, and intensifying human impacts.” 2021.
- Luypaert, T. et al. In YOUMARES 9 – the oceans: our research, our future, edited by Jungblut, S., Liebich, V. and Bode-Dalby, M., 57-80, Switzerland: Springer, 2020.
- Ibid.
- Ibid.
- Rogers, A., O. Aburto-Oropeza, et al. 2020. “Critical Habitats and Biodiversity: Inventory, Thresholds and Governance.”
- Ibid.
- Luypaert, T. et al. In YOUMARES 9 – the oceans: our research, our future, edited by Jungblut, S., Liebich, V. and Bode-Dalby, M., 57-80, Switzerland: Springer, 2020.
- Rogers, A., O. Aburto-Oropeza, et al. 2020. “Critical Habitats and Biodiversity: Inventory, Thresholds and Governance.”
- Ibid.
- Ibid.
- Luypaert, T. et al. In YOUMARES 9 – the oceans: our research, our future, edited by Jungblut, S., Liebich, V. and Bode-Dalby, M., 57-80, Switzerland: Springer, 2020.
- Ibid.
- IPBES. “IPBES Global Assessment Summary for Policymakers.” 2019.
- McCauley, D. J. et al. Marine defaunation: animal loss in the global ocean. Science 347, 1255641 (2015).
- Halpern, B.S., M. Frazier, J. Afflerbach, J.S. Lowndes, F. Micheli, C. O’Hara, C. Scarborough, and K.A. Selkoe. 2019. “Recent Pace of Change in Human Impact on the World’s Ocean.” Scientific Reports 9 (August): 11609. https://doi.org/10.1038/s41598-019-47201-9.
- IPBES. “IPBES Global Assessment Summary for Policymakers.” 2019.
- Ibid.
- IPCC. “Summary for Policymakers. In: Global Warming of 1.5°C. An IPCC Special Report on the impacts of global warming of 1.5°C above pre-industrial levels and related global greenhouse gas emission pathways, in the context of strengthening the global response to the threat of climate change, sustainable development, and efforts to eradicate poverty.” [Masson-Delmotte, V., et al. (eds.)]. World Meteorological Organization, Geneva, Switzerland, 2018, 32 pp.
- Ibid.
- Hughes, T. P. et al. (2018) Spatial and temporal patterns of mass bleaching of corals in the Anthropocene, Science, http://science.sciencemag.org/cgi/doi/10.1126/science.
- Goldberg, L. et al. “Global declines in human‐driven mangrove loss.” Glob Change Biol. (2020) 26: 5844–5855. DOI: 10.1111/gcb.15275.
- Ibid.
- Ibid.
- Ibid.
- Global Mangrove Watch. 2021. https://www.globalmangrovewatch.org. Accessed May 5, 2021.
- MPAtlas. www.mpatlas.org. Accessed May 5, 2021.
- Ibid.
- Secretariat of the Convention on Biological Diversity (2020) Global Biodiversity Outlook 5. Montreal.