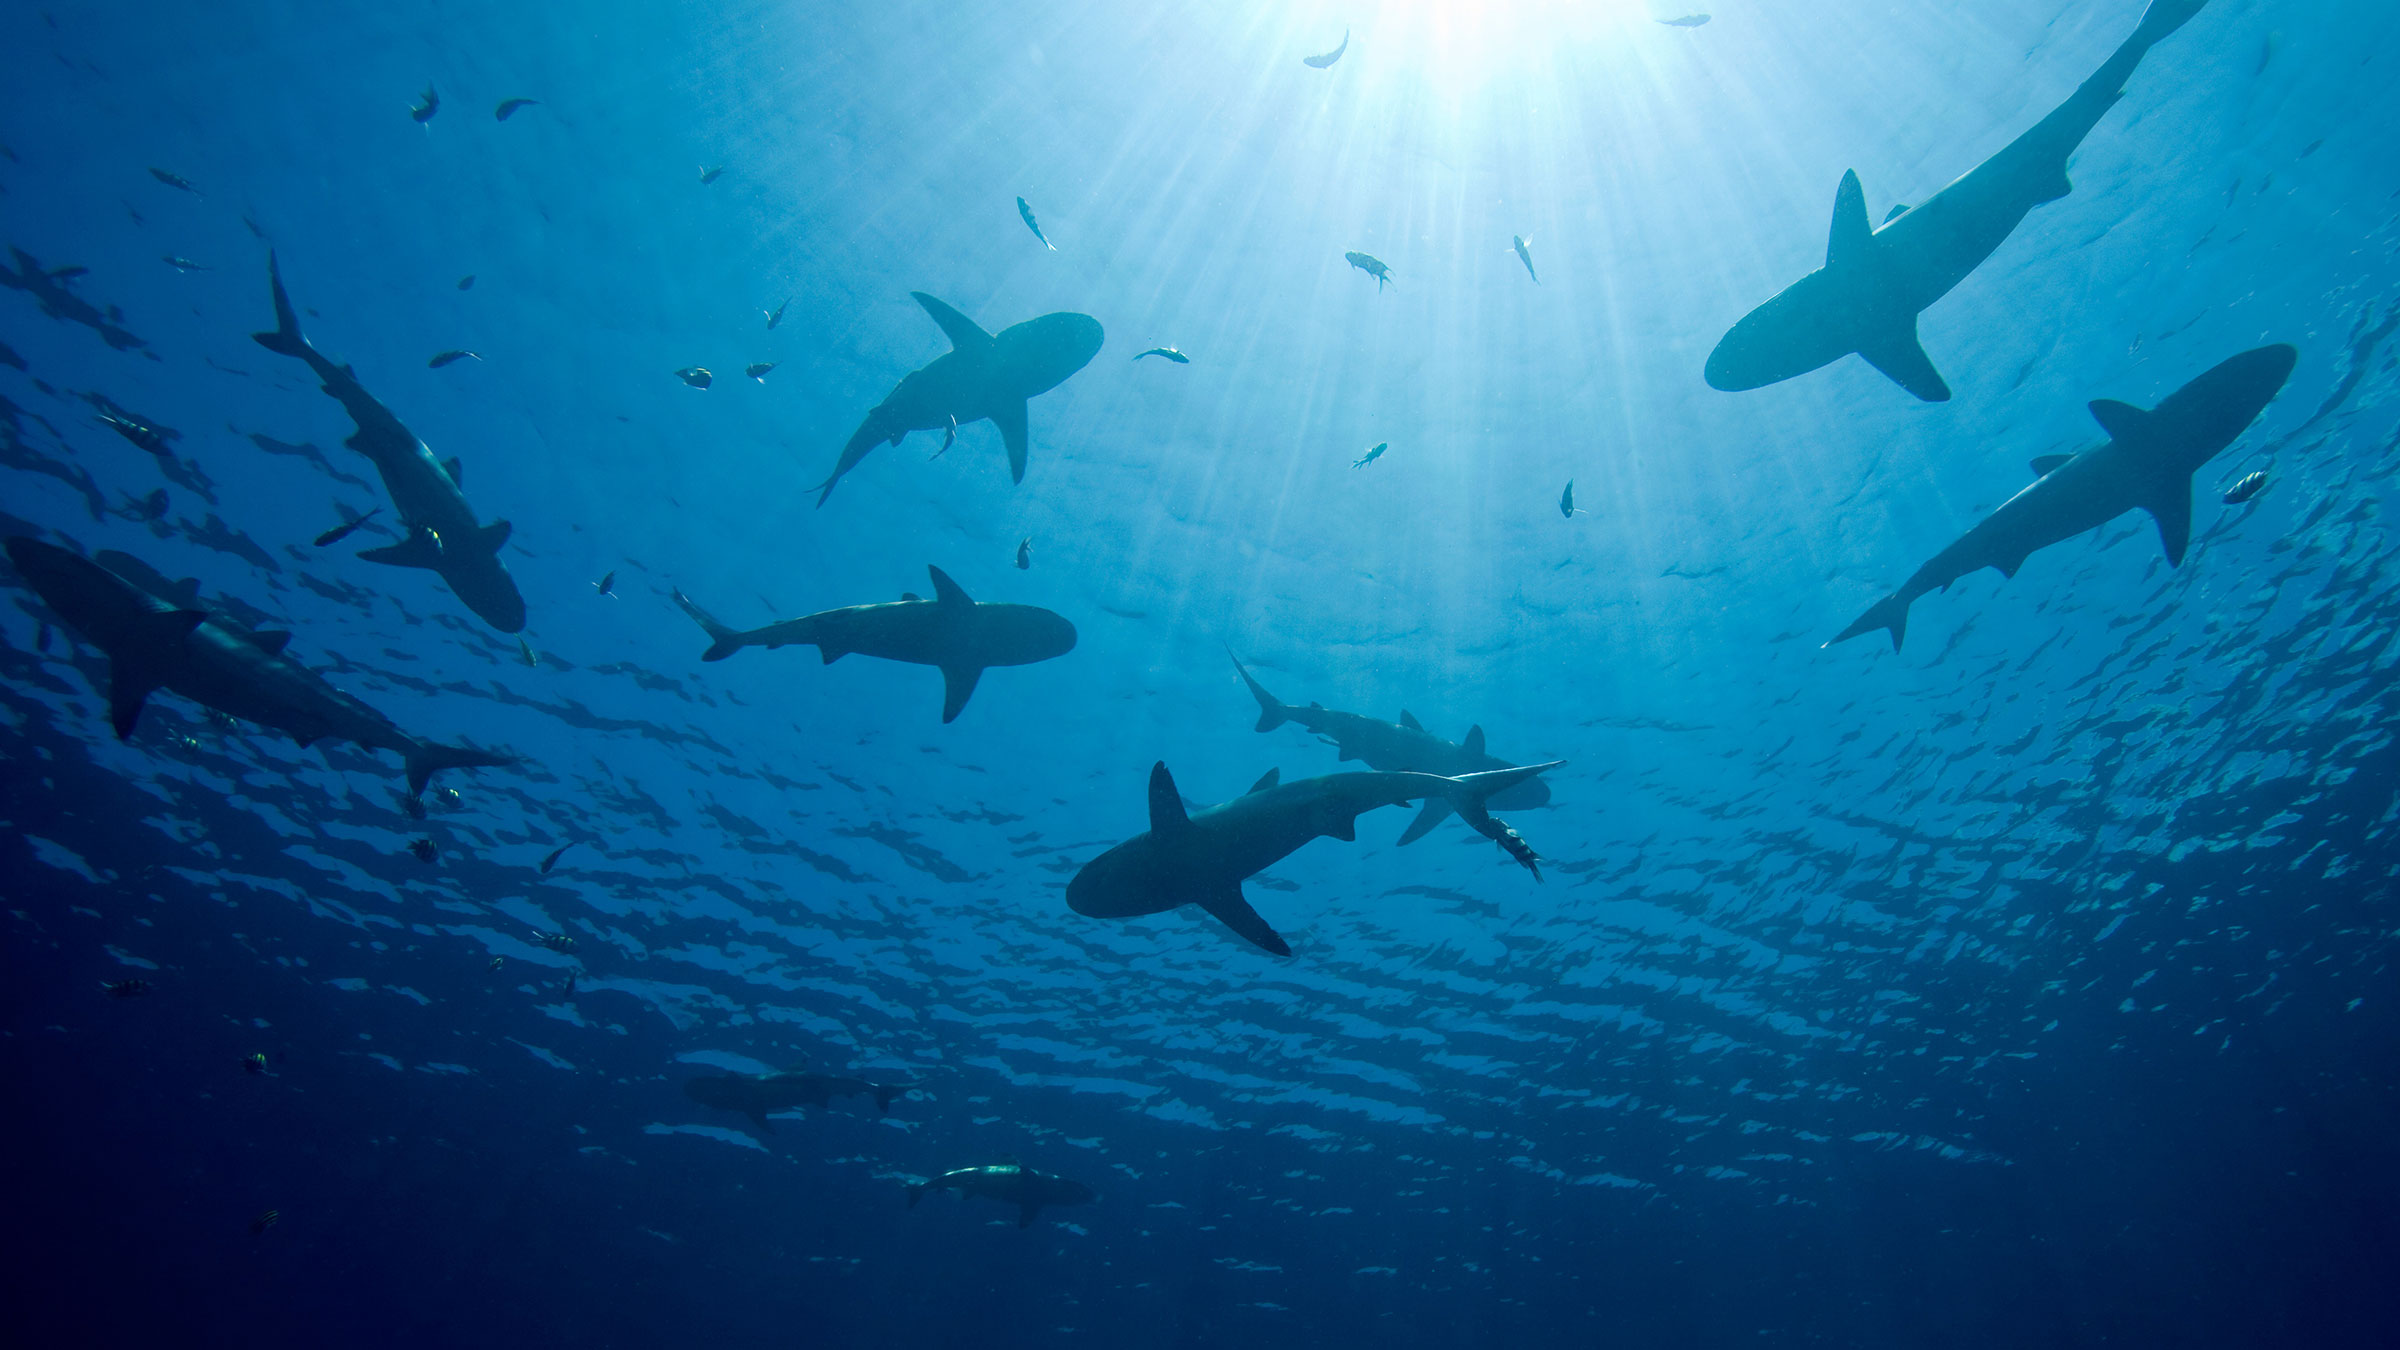
The ocean is our lifeline. We need bold ocean action now.
Our Shared Seas provides trusted data and insights to advance decision-making using evidence-based solutions. Read our new Solutions chapters to make informed action for our blue planet.
Climate policy must harness the power of the ocean
In this decisive decade for climate action, the ocean provides a source of essential solutions. Check out our Ocean-Climate Solutions for an action-oriented toolkit.
The race for biodiversity protection is on.
As world leaders negotiate a new deal for nature, Our Shared Seas offers a Biodiversity and MPA Hub with science-backed recommendations and expert insights for achieving 30 percent ocean protection by 2030.
Join the dialogue on ocean solutions.
Stay connected with the marine conservation community. Subscribe to our newsletter to be the first to learn about new research, expert insights, and relevant ocean events.
The ocean is an essential source of climate solutions.
As the Earth’s largest heat and carbon sink, the ocean is humankind’s most effective buffer against climate change. Read our Solutions chapter to learn more.
Make a date for ocean action
Our Shared Seas tracks the calendar of upcoming ocean events. Learn what’s coming next and use our open-access resources to take informed action.
Our Shared Seas provides timely data, research, and insights to support ocean conservation policy, practice, and philanthropy.
This independent resource synthesizes threats to ocean health and elevates evidence-based solutions for the ocean. Read more about us or dive into the latest ocean issues.
Data Highlights by topic
Global ocean heat content
Source: Cheng L. et al, 2019
The past five years have been the warmest years in the ocean on record.
The ocean absorbs roughly 90% of the warming caused by human carbon emissions. The past five years (2015 to 2019) have ranked as the five warmest years for ocean heat content, confirming a trend that ocean warming has been accelerating since the 1990s. New research suggests that the ocean is absorbing excess heat 40% faster than previously estimated.
Carbon dioxide (direct measurement)
Note: The satellite data is averaged per year. Source: NASA, 2019
Global CO2 emissions have risen steadily in recent decades.
As of early 2019, CO2 emissions had reached 410 parts per million (ppm). A recent IPCC report warned of the impacts of surpassing 1.5°C of warming. At current rates of warming, the world is projected to reach the 1.5°C threshold between 2030 and 2052.
Global wild capture landings
Source: FAO, 2018
Annual production from capture fisheries has remained largely stable or slightly declining for the past 20 years.
Wild capture landings in 2016 followed the same trend as previous years. After peaking in 1996, the trendline for landings has been stable or declining, depending on methodology. Data from FAO indicate that catch was 93 million tons in 2016; catch reconstruction methodologies suggest that landings are about 30 percent higher.
IUU estimate as a portion of total wild capture landings
Source: Watson, Reg A., and A. Tidd, 2018
Illegal, unregulated, and unreported (IUU) catch may account for as much as 25% of wild capture landings.
A recent global study suggests that IUU fishing represented 32 million tons of landings in 2015; this level has been stable in recent years. Estimating the scale of IUU fishing is notoriously difficult and leads to wide confidence intervals, even as advancements in technology and satellite tracking have provided greater transparency recently.
Global aquaculture production (1976–2016)
Source: FAO, 2018
Scenarios of MPA progress toward global targets
Source: Adapted from MPAtlas, 2018.
Global plastics production (1950–2015)
Source: Geyer et al, 2017
Roughly half of all plastic ever produced was made in the last 15 years.
Global plastic production has increased nearly 200-fold, from 2 million tonnes in 1950 to 381 million tonnes in 2015. Plastic production has grown at a compound annual growth rate of 8.4%, roughly 2.5 times the rate of global GDP during 1950-2015.
Total ocean-related grants from philanthropic and ODA sources, 2015–2016
Source: Analysis by CEA Consulting, 2018.
Geographic distribution of marine-related grantmaking, 2015–2016
Source: Analysis by CEA Consulting, 2018.
The philanthropic and development aid sectors have targeted different geographies and issue areas for marine conservation.
Philanthropy has invested heavily in North America and cross-cutting science and global initiatives; these priorities made up 80 percent of ocean-related grantmaking in 2015 and 2016. Development aid has directed its marine grantmaking primarily toward Africa and parts of Asia, with an emphasis on poverty alleviation.
Newsletter Signup for Our Shared Seas
Subscribe to our newsletter to be the first to learn about relevant ocean events, research digests, and expert insights. We value your time and will share only periodic updates with quality content.