iStock/BTWImages
Marine Fisheries and Aquaculture Trends
- Production
- – Wild capture 79m tonnes
- – Marine/brackish aquaculture 32m tonnes
- Growth rate of sector (2015–2019)
- – Marine fisheries 0.1%
- – Aquaculture sector 4.4%
- Certifications or ratings
- – 21% of wild capture landings
- – 4.4% of aquaculture production
Jump to:
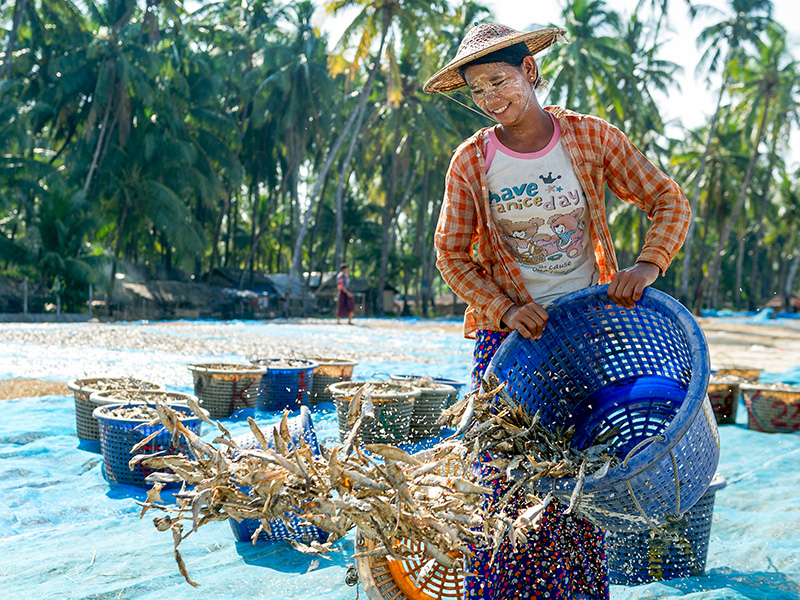
Wild fisheries and aquaculture production provide important contributions to food security and livelihoods globally. Fish provide a source of protein for about 3.3 billion people, playing a particularly crucial role in many developing countries and coastal communities.1 An estimated 60 million people are employed in the primary sector of fisheries and aquaculture, a figure which has gradually trended upward over time.2 Most workers live in developing countries, and the majority are aquaculture workers and small-scale fishers, responsible for half of global fish catch.3
Unsustainable fishing practices threaten both marine wildlife as well as the livelihoods and food supply of seafood-dependent populations. These threats manifest through overfishing; illegal, unreported and unregulated fishing; bycatch (incidental capture); destructive habitat impacts; poor governance and regulatory systems; and human rights and labor abuses. In some cases, aquaculture—or the farming of fish and other seafood—can provide a solution to help meet the growing global demand for seafood. However, unsustainable farming practices can present their own environmental challenges—including habitat destruction, contamination of native wild fish populations, disease spread, and pollution into the ocean—as well as human health and labor abuse concerns.
A synthesis of recent trends from the marine fisheries and aquaculture sectors is outlined below.
From civil society and industry engagement to published literature, the past year has seen an increased focus on the intersection of equity, fisheries health, and fisher well-being.
For instance, new research from collaborators at University of British Columbia, Scripps Institution of Oceanography, and University of California Santa Barbara challenged the long-held theory of change that managing stocks for sustainable levels will produce more fish and more money for fishers. The study found that up to 70 percent of fishers globally would not earn a minimum wage in their home country, even if fisheries were managed to meet maximum sustainable yield (MSY).4 The authors suggest that stronger focus on social issues is necessary to ensure a vibrant ocean and thriving communities. Other efforts—from focusing on the underrecognized role of women in fisheries management and policy to drawing attention to human rights and labor abuses in the seafood supply chain—are highlighting the opportunity to center social dimensions in seafood production.
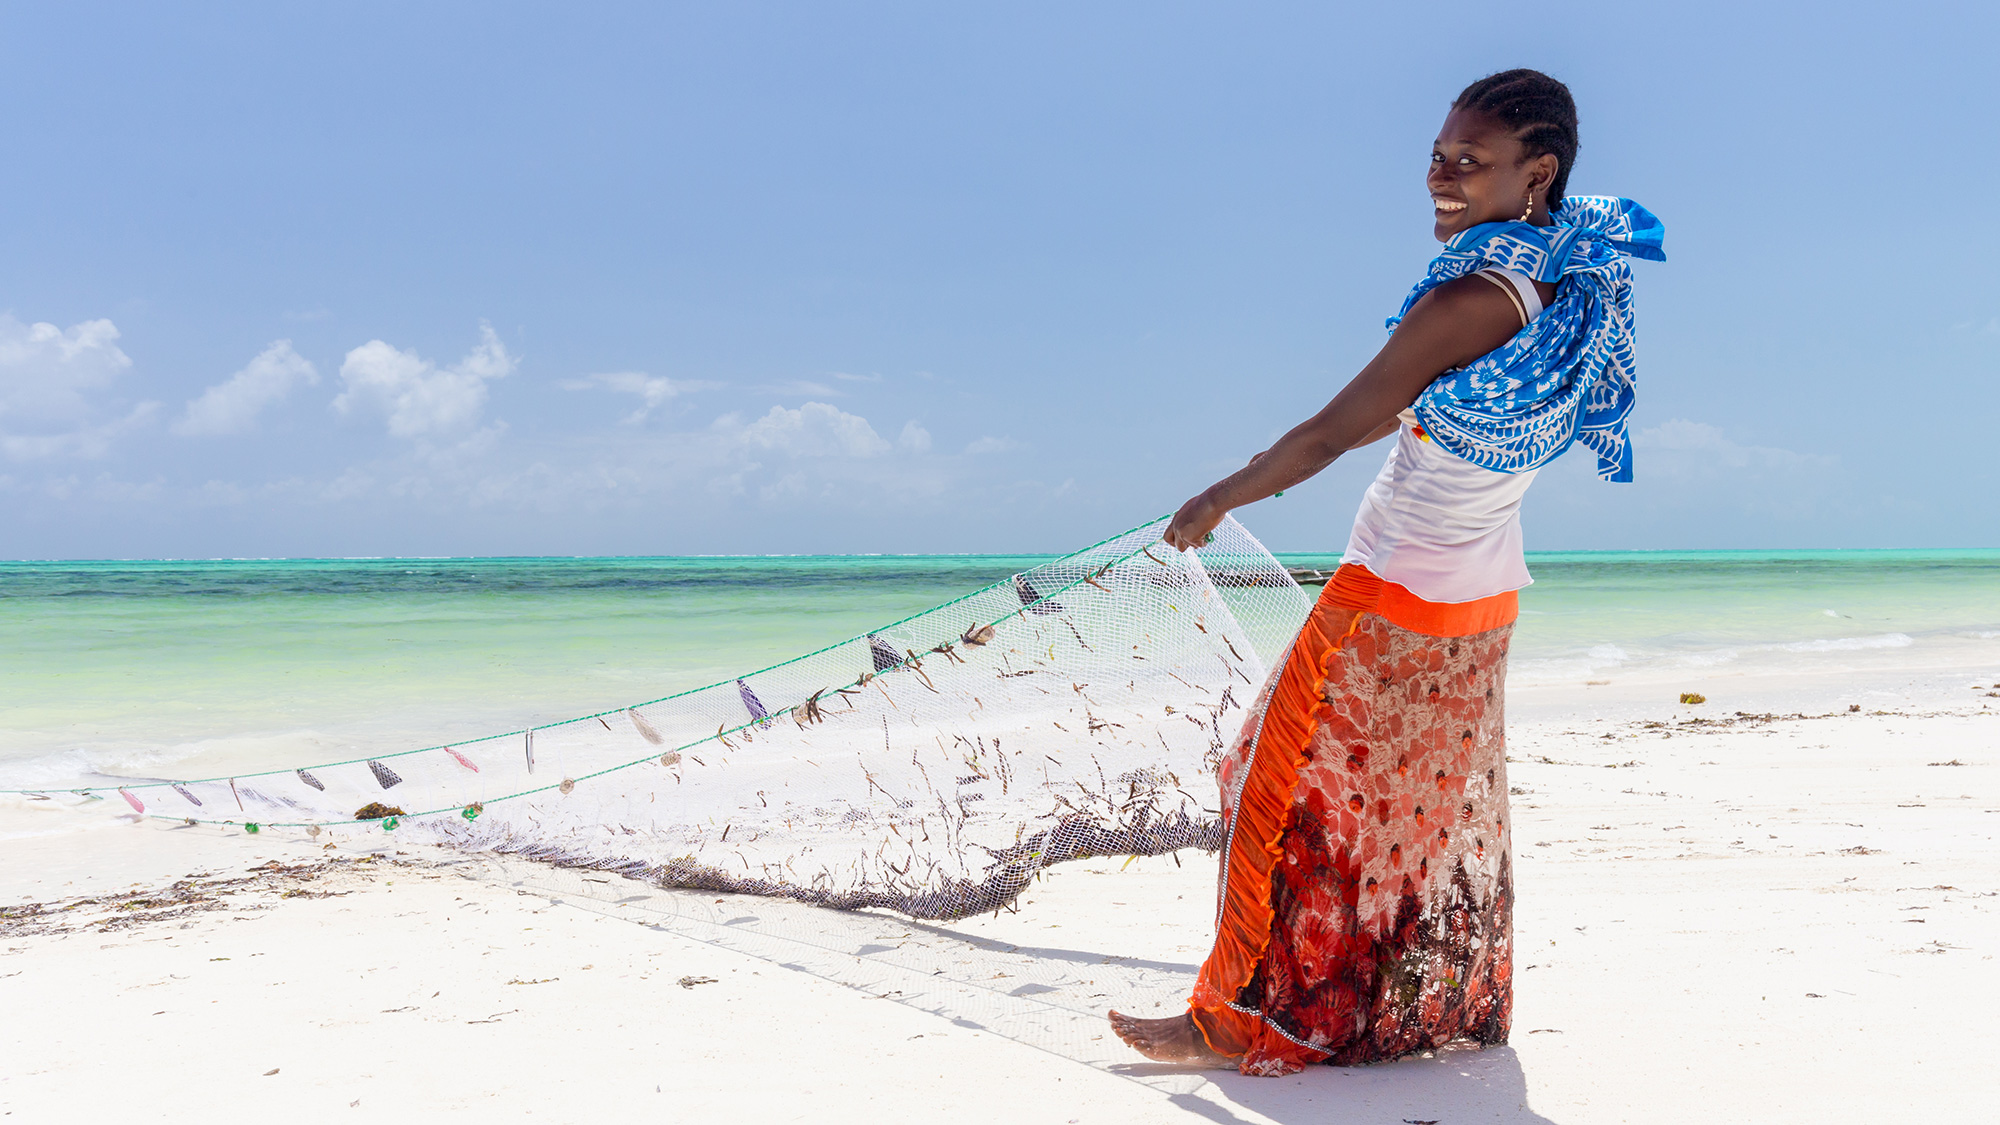
Traditional fishing in Tanzania. Photo: iStock/kasto80
Combined production from wild fisheries and aquaculture has steadily increased, although the aquaculture sector is responsible for most of this growth over the past three decades.
In 2019 (the most recent year for which official data is available), production from brackish and marine aquaculture reached a record-high of 32 million tonnes, growing at a combined growth rate of 4.4 percent during 2015–2019.5 Meanwhile, production from capture fisheries reached 79 million tonnes in 2019, expanding at a slower rate of 0.1 percent during 2015–2019.6
Global fisheries and aquaculture production (tonnes)
The long-term trend in total global capture fisheries has been relatively stable since the mid-1990s.
According to the Food and Agriculture Organization (FAO), which estimates landings primarily based on self-reporting from national governments, wild fisheries production was 79 million tonnes in 2019, a slight reduction from the 18-year high of 83 million tonnes in 2018.7 Two other sources—Sea Around Us8 and Watson and Tidd (2018)9 —apply a catch reconstruction methodology to estimate total production, including difficult-to-monitor categories such as artisanal landings, discards, and illegal fishing. Incorporating these unreported categories of catch places global landings approximately 20 to 35 percent higher than the FAO’s officially reported figures. (The most recent year of data from the Sea Around Us is 2018, while Watson and Tidd estimated production through 2015.) Both catch reconstruction methodologies suggest that wild capture landings have been on a slight downward trajectory since the mid-1990s, despite increases in overall fishing effort over the same period.10
Marine fisheries production, by data source (tonnes)
A handful of countries account for a significant portion of global fisheries production. The top seven capture producers—China, Indonesia, Peru, the United States, Russia, India, and Vietnam—account for roughly 50 percent of total marine fisheries production.11 Meanwhile, the top 20 producers represent nearly 75 percent of total global capture production.12 In 2019, China alone accounted for 15 percent of global wild capture landings.
Top 20 countries for marine fisheries production (tonnes)
In terms of recent fishing activity, satellite tracking data suggests an unprecedented global decline in fishing activity in 2020, at least partly due to the COVID-19 pandemic. Changes in fishing activity varied significantly by region.
Based on this data, Global Fishing Watch estimates a 9 percent decrease in active fishing vessels and a 5 percent decrease in fishing hours during 2020 compared to 2019 levels.13 This is potentially a substantial underestimate of the actual decline in fishing activity.14
As shown in the map below, fishing activity declined in many parts of China, Europe, Argentina, India, and sections of the high seas in the western Pacific during 2020. In contract, increases in fishing activity were observed along the Gulf and Atlantic coasts in the United States, northwest Africa, in the central Indian Ocean, and off the coasts of South Korea and Japan. Emerging research will likely provide a more detailed picture on the impacts of the Covid-19 pandemic on seafood production, from sub-national changes in fishing activity to impacts on livelihoods, seafood supply chains, and consumer behavior.
Changes in fishing activity by region, 2020
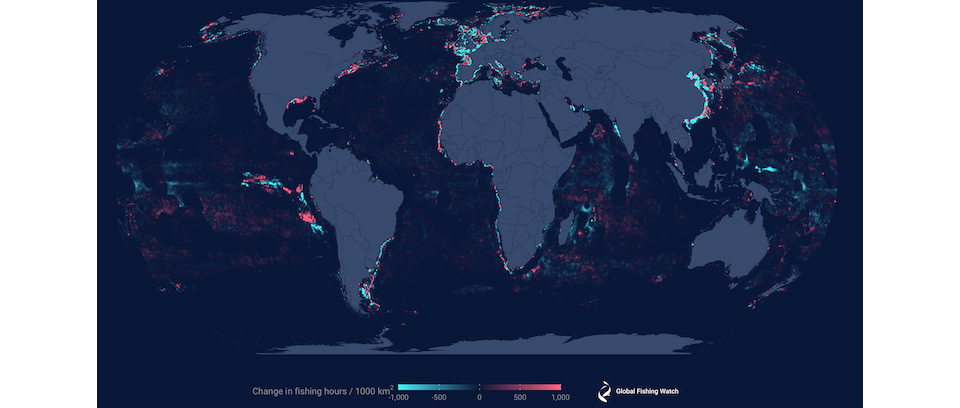
Change in fishing hours per 1000 square kilometers in 2020 relative to the average activity in that grid cell between 2018-2019. Large declines in activity (blue) are observed in China, Europe, India, Argentina, and in the high seas pockets of the western Pacific. Increases (pink) can be seen along the Gulf and Atlantic coasts of the United States, northwest Africa, off the coasts of South Korea and Japan, and in the central Indian Ocean. Figure exclude vessels new to the AIS data in 2020. Link to source: https://globalfishingwatch.org/data/covid-19-brings-unmatched-downturn-in-global-fishing-activity/
Several of the world’s largest fishing countries saw curtailed fishing activity during 2020. China and the United Kingdom observed the largest reductions in fishing activity within their EEZs, with annual decreases of 13.5 percent and 16.5 percent, respectively.15 Meanwhile, the United States, South Korea, and Japan each had more than a 15 percent increase in fishing hours during 2020.
Changes in fishing activity by country, 2020
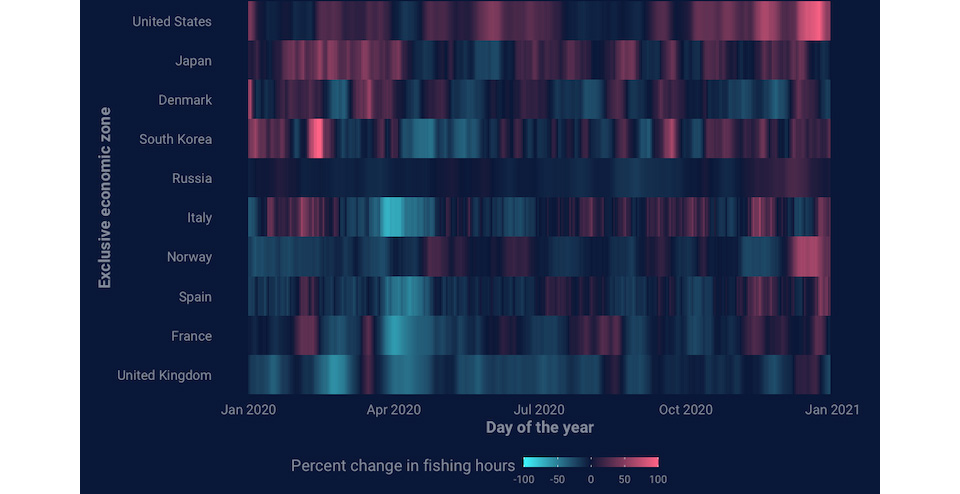
Daily percent change in 2020 fishing activity relative to the 2018-2019 average by EEZ for the top 10 fishing nations in the AIS data, excluding China. Calculations based on a two-week rolling average number of fishing hours. Each day of 2020 is represented sequentially by a colored band, with groups of blue/pink indicating sustained periods of lower/higher average fishing activity. Source https://globalfishingwatch.org/data/covid-19-brings-unmatched-downturn-in-global-fishing-activity/
The status of fisheries resources varies significantly by geography and is closely related to the level of fisheries management.
According to data from Sea Around Us, which considers both assessed and unassessed stocks, 20 percent of stocks were considered overexploited or collapsed in 2018, the most recent year for which data is available.16 The proportion of stocks considered overexploited or collapsed has stayed roughly consistent in recent years. Data from the Sea Around Us indicate that the proportion of stocks undergoing rebuilding has slowly increased since the mid-1990s, from less than 1 percent in 1994 to nearly 12 percent in 2018.17
Stock status according to the Sea Around Us (%)
For the half of the world’s fish catch for which abundance data are available, there has generally been an uptick in the biomass of fish stocks in recent years.18 In contrast, unassessed stocks are believed to have continued to decline. In several countries, reduction in fishing pressure is directly associated with fisheries management policy changes.
Average trends in Mean B\Bmsy for assessed and unassessed stocks
Overfishing is closely correlated with insufficient fisheries management capacity.
The Fisheries Management Index (FMI), which relied on expert surveys to rate management effectiveness on a stock-by-stock basis, found substantial variation in management globally.19 The analysis found that three management attributes related to science-based limits are the largest determining factors of a country’s stock health: effectiveness of stock assessments, strength of fishing pressure limits, and comprehensiveness of enforcement programs.20
The FMI survey was conducted in 2016 and 2018. Over that two-year period, there was relatively little change in the FMI scores of individual countries. The FMI scores continue to hold a strong positive correlation with GDP per capita and a negative correlation with capacity-enhancing subsidies.
Fisheries Management Index (score of 0–1)
In 2021, the Minderoo Foundation released the Global Fishing Index (GFI) to assess the governance and sustainability of the world’s fisheries. During the inaugural year of the GFI, no country received an ‘A’ or ‘B’ grade based on the state of fish stocks and local governance systems. Six countries were assigned a ‘C’ grade while 20 countries received an ‘F’ grade.21 The report highlighted three core challenges to science-based fisheries management in many countries around the world: fisheries data are not consistently collected or analyzed; data are not used for fisheries management; and fisheries laws and policies are not enforced.
Country scores in the Global Fishing Index (score of A–F)
| Overall Grade | Country | Governance capacity | Progress score |
| C | Chile | 9 | 47.73 |
| C | Iceland | 8 | 40.07 |
| C | Norway | 8 | 48.18 |
| C | United States of America | 8 | 44.98 |
| D | Argentina | 6 | 31.26 |
| D | China | 6 | 11.41 |
| D | India | 7 | 26.07 |
| D | Indonesia | 8 | 18.12 |
| D | Japan | 8 | 20.86 |
| D | Mauritania | 6 | 15.03 |
| D | Mexico | 6 | 17.80 |
| D | Peru | 4 | 59.08 |
| D | Philippines | 8 | 22.15 |
| D | Republic of Korea | 8 | 13.55 |
| D | Russian Federation | 6 | 30.62 |
| D | United Kingdom | 9 | 35.61 |
| E | Myanmar | 6 | 1.13 |
| E | Thailand | 7 | 7.92 |
| F | Malaysia | 5 | 5.83 |
| F | Viet Nam | 3 | 1.35 |
Note: GFI scores are based on a scale of A-F. Source: Minderoo Foundation, 2021. “The Global Fishing Index: Assessing the sustainability of the world’s marine fisheries.” Perth, Western Australia, 60 pp.
The research teams for the Fisheries Management Index and Global Fishing Index applied different methodologies, which led to some differences in results. Most notably, Myanmar, Brazil, and Tanzania are outliers that scored relatively high on the GFI but received somewhat low FMI scores. Another outlier between the two studies includes Indonesia and the Philippines receiving FMI scores of less than 0.5 and a GFI score of 8—the latter of which is the same score assigned to countries such as Iceland, Norway, and Canada which ranked high on the FMI.
FMI Scores versus GFI Governance Capacity
In 2021, a seminal report shed new light on the age-old practice of bottom trawling, one of the most destructive fishing methods.
Bottom trawlers catch 26 percent of the total global marine fisheries catch. The report found that over 99 percent of bottom trawling worldwide occurs inside the Exclusive Economic Zones of coastal nations—with much of the effort focused within just 12 miles of shore—posing risks to critical habitats and traditional, small-scale, artisanal fishing operations.22 Roughly 50 percent of all bottom trawled fish is caught in the EEZs of Asia or by the foreign fleets of Asian countries.23
Global catch by gear type (within EEZs)
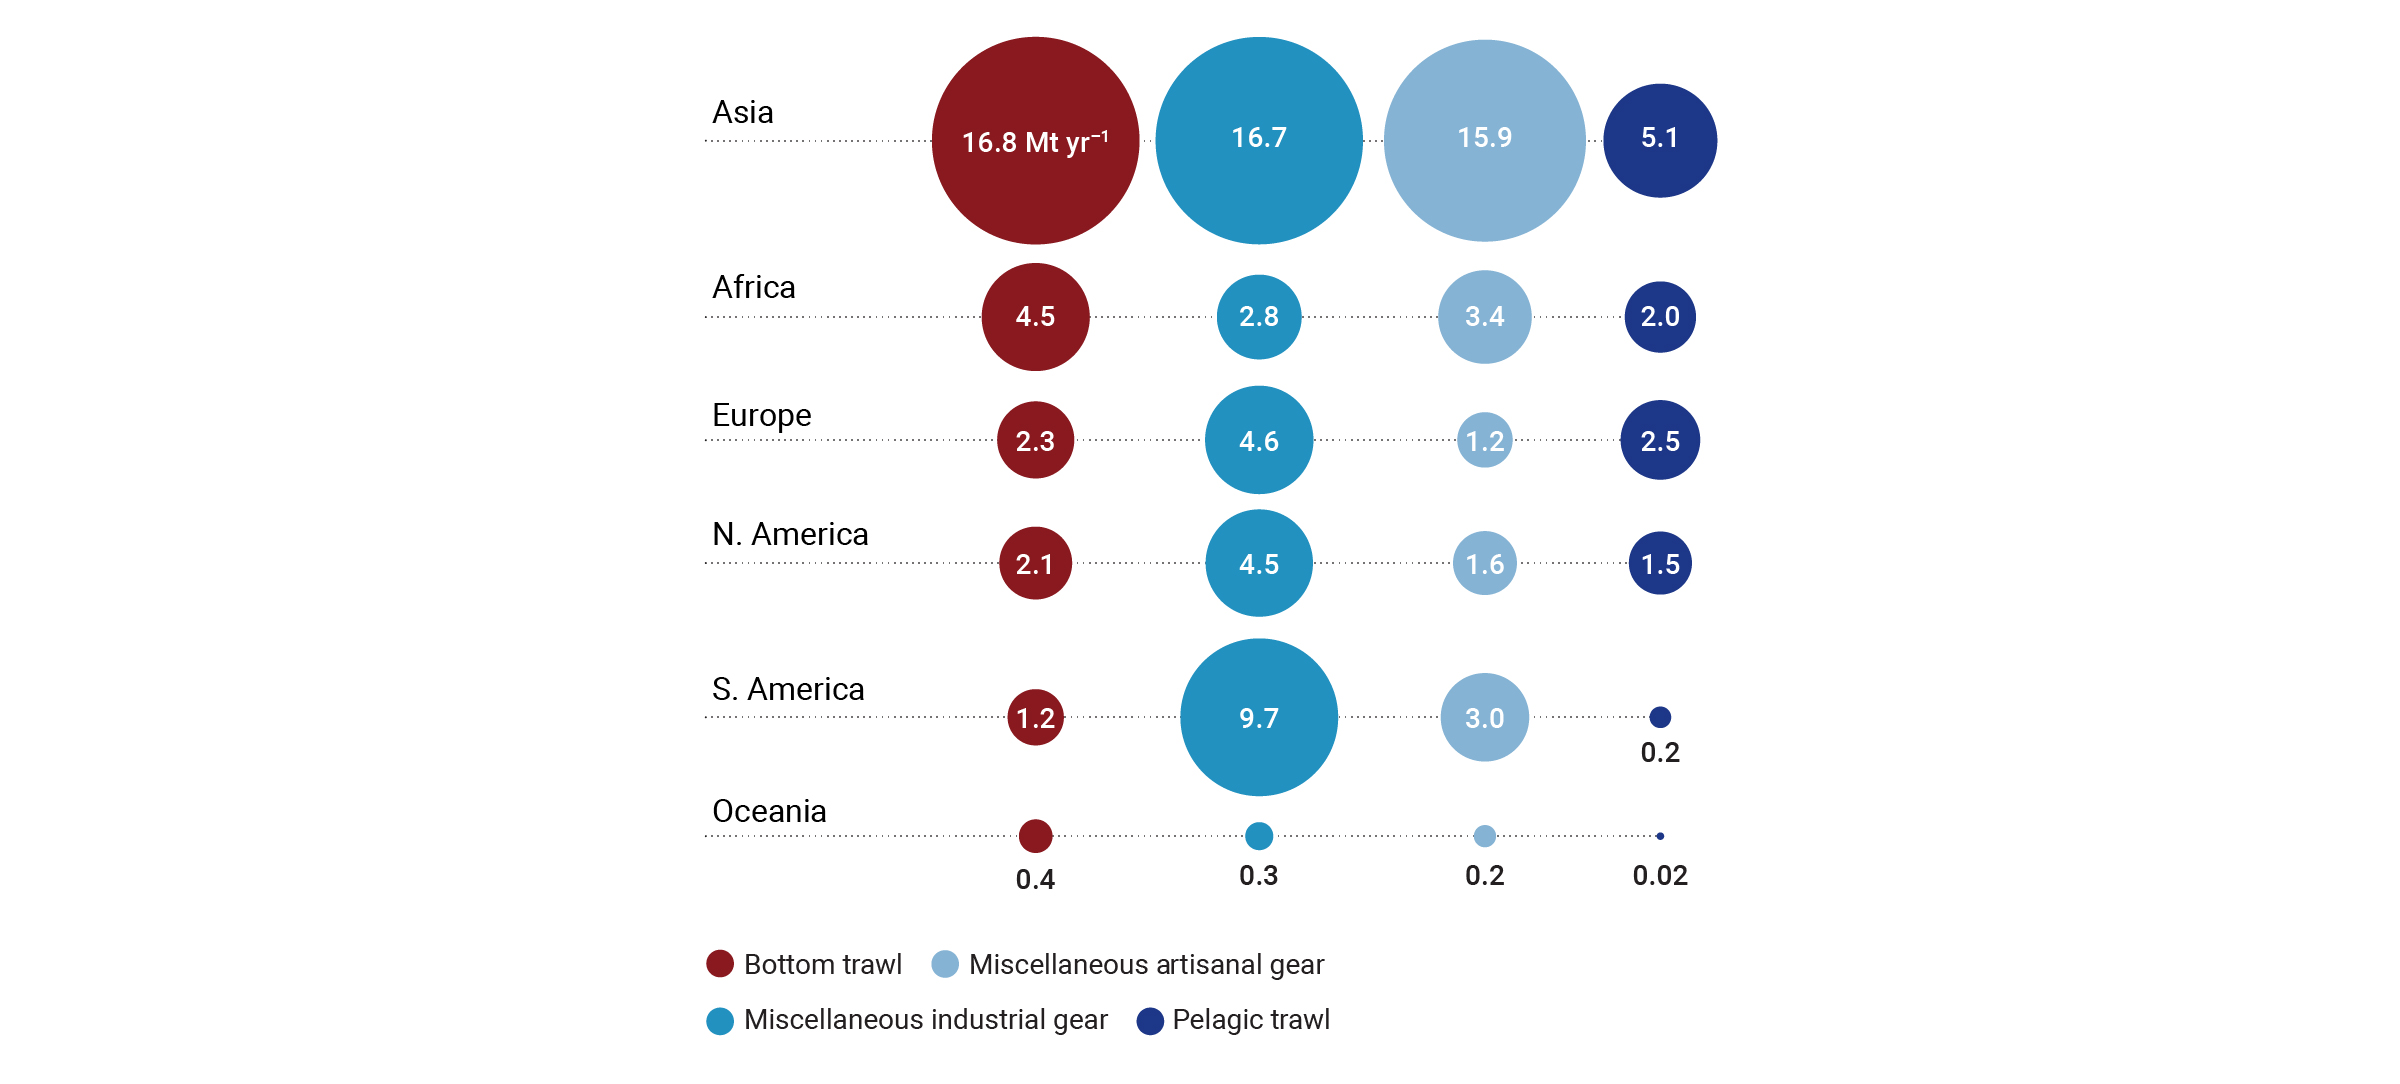
Source: Steadman, D. et al. “New perspectives on an old fishing practice: Scale, context and impacts of bottom trawling.” 2021. https://oursharedseas.com/new-perspectives-on-an-old-fishing-practice.
The top five bottom trawling countries—as measured by average catch over the most recent decade for which there is complete data (2007–2016)—are China, Vietnam, Indonesia, India, and Morocco. China alone accounts for 15 percent of the total bottom trawled catch.24 Whereas bottom trawling is expanding rapidly in Asia, the practice is declining or staying constant in most other parts of the world.
Top 10 bottom trawling countries by total catch and percentage of catch
| Country | Average annual bottom trawl catch (2007–2016) in million tonnes | Percentage of global bottom trawl catch |
| China | 4.1 | 14.9 |
| Vietnam* | 2.3 | 8.3 |
| Indonesia | 2.2 | 8.1 |
| India* | 1.9 | 6.8 |
| Morocco* | 1.8 | 6.5 |
| Japan | 1.8 | 6.4 |
| South Korea | 1.1 | 4.1 |
| United States | 1.1 | 4.0 |
| Argentina* | 0.7 | 2.5 |
| Malaysia | 0.7 | 2.4 |
*Vietnam, India, Morocco, and Argentina have high uncertainty in the disaggregation of reconstructed catch estimates by gear type from SAU due to large amounts of unreported data and unidentified species in their catch reports. Source: Steadman, D. et al. “New perspectives on an old fishing practice: Scale, context and impacts of bottom trawling.” 2021. https://oursharedseas.com/new-perspectives-on-an-old-fishing-practice.
To address overfishing and support livelihoods for coastal communities, the marine conservation community and industry have pursued market-driven efforts to promote fisheries sustainability. Currently, 21 percent of marine fisheries landings are considered rated or certified.
In recent years, the conservation community has placed an increasing emphasis on human rights and labor rights across seafood markets initiatives.
For the first time ever, the total number of fisheries certified by the Marine Stewardship Council (MSC) exceeded 1,000. Meanwhile, the number of fisheries either in assessment or suspension are both in decline.
Wild capture landings under Marine Stewardship Council (MSC) Certification (units of certification)
MSC and FIP certification, by species (%)
Within Fishery Improvement Projects, the distribution of FIPs by continent has stayed relatively the same over the last 3 years, with an exception of a slight decline of FIPs in Asia and an increase of FIPs in Africa.
Distribution of FIPs by continent
Distribution of FIPs by species
Volume of wild capture landings under FairTrade Certification (tonnes)
While marine fisheries landings have generally plateaued since the mid-1990s, aquaculture has driven continued growth in global seafood production.
The aquaculture sector has seen many dynamic changes over the past two decades, one of which includes transitioning from a relatively small role to a more mainstream role in the global food system.
A landmark study released in 2021 identified key global trends and challenges in the aquaculture sector over the past two decades. Those trends include:
- The aquaculture sector has made considerable progress in increasing efficiency in the feed and fish nutrition sectors, with lower fish-in-fish-out ratios for all fed species. However, there has been an increase in dependence on feed ingredients from terrestrial systems.
- The main species groups contributing to the top 75 percent of aquaculture production in 2017 included seaweeds, carps, bivalves, tilapia, and catfish, with freshwater fish accounting for 75 percent of the global edible aquaculture volume.
- The effects of climate change can contribute to losses in aquaculture productivity and livelihoods, due to suboptimal growing temperatures, sea-level rise and subsequent saltwater intrusion, infrastructure damage, droughts, and freshwater shortages, rising feed costs, and amplified uncertainties surrounding harmful algal blooms.
Aquaculture in marine and brackish waters increased from 13 million tonnes in 2000 to 32 million tonnes in 2019.26 Currently, production from marine and brackish aquaculture is growing at the rate of roughly 500,000 tonnes annually.
Aquaculture production by species group (tonnes)
China continues to produce more aquaculture than the rest of the world combined. Other major producers include India, Indonesia, Vietnam, Bangladesh, Egypt, Ecuador,27 and Norway. Despite China’s dominant role in the aquaculture sector, growth rates in South America and Africa have been strikingly high during the past two decades, pointing to the growing globalization of the sector.
Aquaculture production by continent (tonnes)
Not all aquaculture production has the same environmental footprint. A handful of farmed species pose a greater threat to the environment in terms of dependency on feed inputs, freshwater use, disease introduction, biodiversity impacts, and other concerns. These concerns are most concentrated in the production of marine finfish, diadromous fish (e.g., salmon, eel), and crustaceans such as shrimp. These species of concern made up approximately 40 percent of marine and brackish aquaculture production in 2019, up from 27 percent of total production in 2000.28
Aquaculture production by species of concern (tonnes)
Species of concern
Aquaculture Species of Concern
- Amberjacks*
- Atlantic salmon
- Ayu sweetfish
- Banana prawn
- Barramundi (Giant seaperch)
- Bastard halibut
- Chinese mitten crab
- Chinook salmon (Spring salmon, King salmon)
- Clearhead icefish
- Cobia
- Coho salmon (Silver salmon)
- Fleshy prawn
- Freshwater prawns, shrimps*
- Giant river prawn
- Giant tiger prawn
- Groupers*
- Indo-Pacific swamp crab
- Jacks, crevalles*
- Japanese amberjack
- Japanese eel
- Japanese jack mackerel
- Japanese seabass
- Kuruma prawn
- Large yellow croaker
- Lefteye flounders*
- Longfin yellowtail
- Marine crabs*
- Marine Fishes*
- Metapenaeus shrimps*
- Milkfish
- Mullets*
- Obscure pufferfish
- Oriental river prawn
- Pacific bluefin tuna
- Penaeus shrimps*
- Pond smelt
- Porgies, seabreams*
- Portunus swimcrabs*
- Rainbow trout
- Red drum
- Righteye flounders*
- River eels*
- River prawns*
- Salmonoids*
- Silver seabream
- Snubnose pompano
- Sturgeons*
- Tiger pufferfish
- Tropical spiny lobsters*
- Trouts*
- Turbot
- White trevally
- Whiteleg shrimp
- Yellowfin tuna
Aquaculture Species Groups Not of Concern
- Brown seaweeds
- Red seaweeds
- Green seaweeds
- Mussels
- Pearls, mother-of-pearl, shells
- Sea-squirts and other tunicates
- Scallops, pectens
- Oysters
* not elsewhere identified
In the same way that certifications and ratings have expanded in the wild capture sector, the aquaculture sector has experienced even more rapid growth (proportionally) in product under responsible sourcing. Certifications and ratings programs have a shared goal of encouraging aquaculture to pursue continuous improvement toward environmental sustainability, social responsibility, and economic growth. Additional information on the complementary role of certifications and ratings programs can be found here.
Roughly 2.11 percent of global aquaculture production is certified under the Aquaculture Stewardship Council. The top five countries with the most certified volume include Norway, Chile, Indonesia, Vietnam, and Ecuador.
Certified aquaculture production under the Aquaculture Stewardship Council (ASC) (tonnes)
The share of aquaculture certified under the Best Aquaculture Practices, a program of the Global Seafood Alliance, has steadily increased, from 0.4 percent in 2010 to 1.8 percent in 2017 and 2.3 percent in 2021. The top five countries with the most certified volume under the BAP include Chile, Canada, China, India, and Vietnam.
Certified aquaculture production under the Best Aquaculture Practices (BAP) (tonnes)
Source: Certifications and Ratings Collaboration. “Data Tool.” 2021. Accessed January 4, 2022. https://certificationandratings.org/datatool/.
Notes
- FAO. 2020. The State of World Fisheries and Aquaculture 2020. Sustainability in action. Rome. https://doi.org/10.4060/ca9229en.
- Ibid.
- Ibid.
- Giron-Nava, Alfredo, Vicky W. Lam, Octavio Aburto‐Oropeza, William W. Cheung, Benjamin S. Halpern, U. Rashid Sumaila, and Andrés M. Cisneros-Montemayor. “Sustainable Fisheries Are Essential but Not Enough to Ensure Well‐Being for the World’s Fishers.” Fish and Fisheries 22, no. 4 (July 30, 2021): 812–21. https://doi.org/10.1111/faf.12552.
- FAO. 2021. FishStatJ Manual. Version 4.01.8. Accessed December 6, 2021.
- Ibid.
- Ibid.
- Pauly D., Zeller D., Palomares M.L.D. (Editors), 2020. Sea Around Us Concepts, Design and Data (seaaroundus.org).
- Watson, Reg A., and A. Tidd. “Mapping Nearly a Century and a Half of Global Marine Fishing: 1869–2015.” Marine Policy 93 (July 2018): 171–77. https://doi.org/10.1016/j.marpol.2018.04.023.
- J.D. Bell, R.A. Watson, Y. Ye. “Global fishing capacity and fishing effort from 1950–2012.” Fish and Fisheries. 18 (3) (2017) 489–505
- FAO. 2021. FishStatJ Manual. Version 4.01.8. Accessed December 6, 2021.
- Ibid.
- Global Fishing Watch, “COVID-19 Brings Unmatched Downturn in Global Fishing Activity – Global Fishing Watch.” March 11, 2021. https://globalfishingwatch.org/data/covid-19-brings-unmatched-downturn-in-global-fishing-activity/.
- Ibid.
- Ibid.
- Pauly D., Zeller D., Palomares M.L.D. (Editors), 2020. Sea Around Us Concepts, Design and Data (seaaroundus.org).
- Ibid.
- RAM Legacy Stock Assessment Database. 2018. Version 4.44-assessment-only. Released December 12, 2018. Accessed May 20, 2018. Retrieved from DOI:10.5281/zenodo.2542919.
- Melnychuk, Michael C., Emily Peterson, Matthew Elliott, and Ray Hilborn. “Fisheries Management Impacts on Target Species Status.” Proceedings of the National Academy of Sciences 114, no. 1 (January 3, 2017): 178–83. https://doi.org/10.1073/pnas.1609915114.
- Ibid.
- Minderoo Foundation, 2021. “The Global Fishing Index: Assessing the sustainability of the world’s marine fisheries.” Perth, Western Australia, 60 pp.
- Steadman, D. et al. “New perspectives on an old fishing practice: Scale, context and impacts of bottom trawling.” 2021. https://oursharedseas.com/new-perspectives-on-an-old-fishing-practice.
- Ibid.
- Ibid.
- Naylor, R.L., Hardy, R.W., Buschmann, A.H. et al. “A 20-year retrospective review of global aquaculture.” Nature 593, E12 (2021). https://doi.org/10.1038/s41586-021-03508-0.
- FAO. 2021. FishStatJ Manual. Version 4.01.8. Accessed December 6, 2021.
- Naylor, R.L., Hardy, R.W., Buschmann, A.H. et al. “A 20-year retrospective review of global aquaculture.”
- Analysis by CEA Consulting based on data from: FAO. 2021. FishStatJ Manual. Version 4.01.8. Accessed December 6, 2021.