The report, Funding Trends 2025: Tracking the State of Global Ocean Funding, presents trends on global ocean funding over the past decade, from 2015 to 2024. The primary focus is on mapping philanthropic funding from foundations for conservation-relevant themes, inclusive of efforts to promote ocean-climate solutions and fund marine research. CEA Consulting has updated this report every other year as a resource for the ocean sector to understand how funding is evolving over time and across issues and geographies.
This report provides a detailed analysis of funding trends by issue area and geography; a fresh look at the top funders and recipients of foundation funding over the past decade; and new analyses on funding trends for corals, deep seas, marine energy decarbonization, and small-scale fisheries. Readers are welcome to use all figures and numbers from this report, provided that the source citation is included.
Download the Report
Help us understand how this resource is being used by the community. Please answer the questionnaire then click “Submit” to receive a download link for the report.
Key findings from this report include:
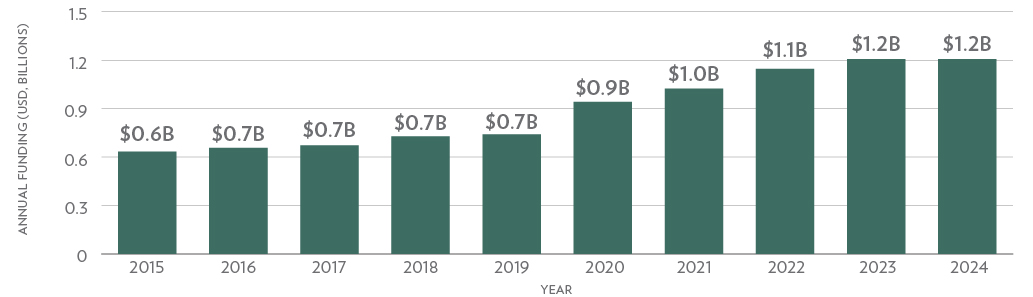
Total Foundation Ocean Funding, 2015–2024
-
- After a period of rapid growth, foundation ocean funding has remained at approximately USD 1.2 billion in the period of 2023–2024. Funding began at approximately USD 0.5 billion in 2010–2014, before scaling steadily over the past decade.
- The annual average funding to ocean-climate has grown over 500 percent between the first half and second half of the past decade; in comparison, funding for fisheries and aquaculture has grown only 20 percent over the same time period.
- Over the past decade, funding has increased fastest in Central America (260%), the High Seas (190%), and Africa (110%).
- These trends are being driven by growing momentum from some of the largest ocean funders to increase funding to ocean-climate mitigation and sequestration solutions as well as efforts to protect 30 percent of the ocean by 2030. At the same time, funding amounts to global initiatives and work based in North America continue to increase, and the gap between funding to high income and lower income countries has not narrowed.
Suggested Citation:
Lewis, F., Saliman, A., & Hardt, M. “Funding Trends 2025: Tracking the State of Global Ocean Funding.” CEA Consulting. 2025.