Data Highlights
Carbon dioxide (CO2) emissions
410 ppm (2019)
NASA, 2019
Global temperature change
1°C (1.8°F) increase since 1880 (2019)
NASA, 2019
Sea-level rise
3.2 mm increase per year (2019)
NASA, 2019
Jump to:
Overview of climate impacts on the ocean
The warming of the global climate is unequivocal. The ocean plays a pivotal, if not underappreciated, role as a climate regulator. The ocean has absorbed the vast majority of global warming heat to date, roughly 93 percent of excess heat energy since the 1970s.1 The ocean also captures about a quarter of anthropogenic carbon dioxide (CO2) emissions emitted annually and will ultimately store the large majority of that carbon.2
While the marine environment provides an important buffer against the impacts of climate change to lessen atmospheric warming, this is creating a dangerous trio of impacts on the ocean: warming, acidification, and deoxygenation. Already, the cumulative effects of these impacts have contributed to profound and immediate changes around the world, from rising sea levels, increases in rainfall intensity, melting of ice in the polar regions, mass coral reef bleaching events, kelp die-offs, localized losses of shellfish due to acidic seawater, and shifting fish stocks.3 While extreme weather events are often seen as a more tangible manifestation of these changes, there are less visible shifts taking place below the surface of the water. The physical properties and chemistry of the ocean are changing at a faster rate than any other time in the past 300 million years.4
Indicators of a changing climate
Carbon dioxide emissions
Global CO2 emissions have risen steadily in recent decades. Between 2008 and 2017, fossil fuel CO2 emissions increased at a rate of 1.5 percent per year.5 As of early 2019, CO2 emissions had reached 410 parts per million (ppm).6 Efforts to decarbonize have gained momentum in some parts of the world—notably through the increased use of renewables—but these efforts have not outpaced a growing global economy and the expanding use of coal, oil, and gas to meet global energy needs.
Carbon dioxide (direct meas.)
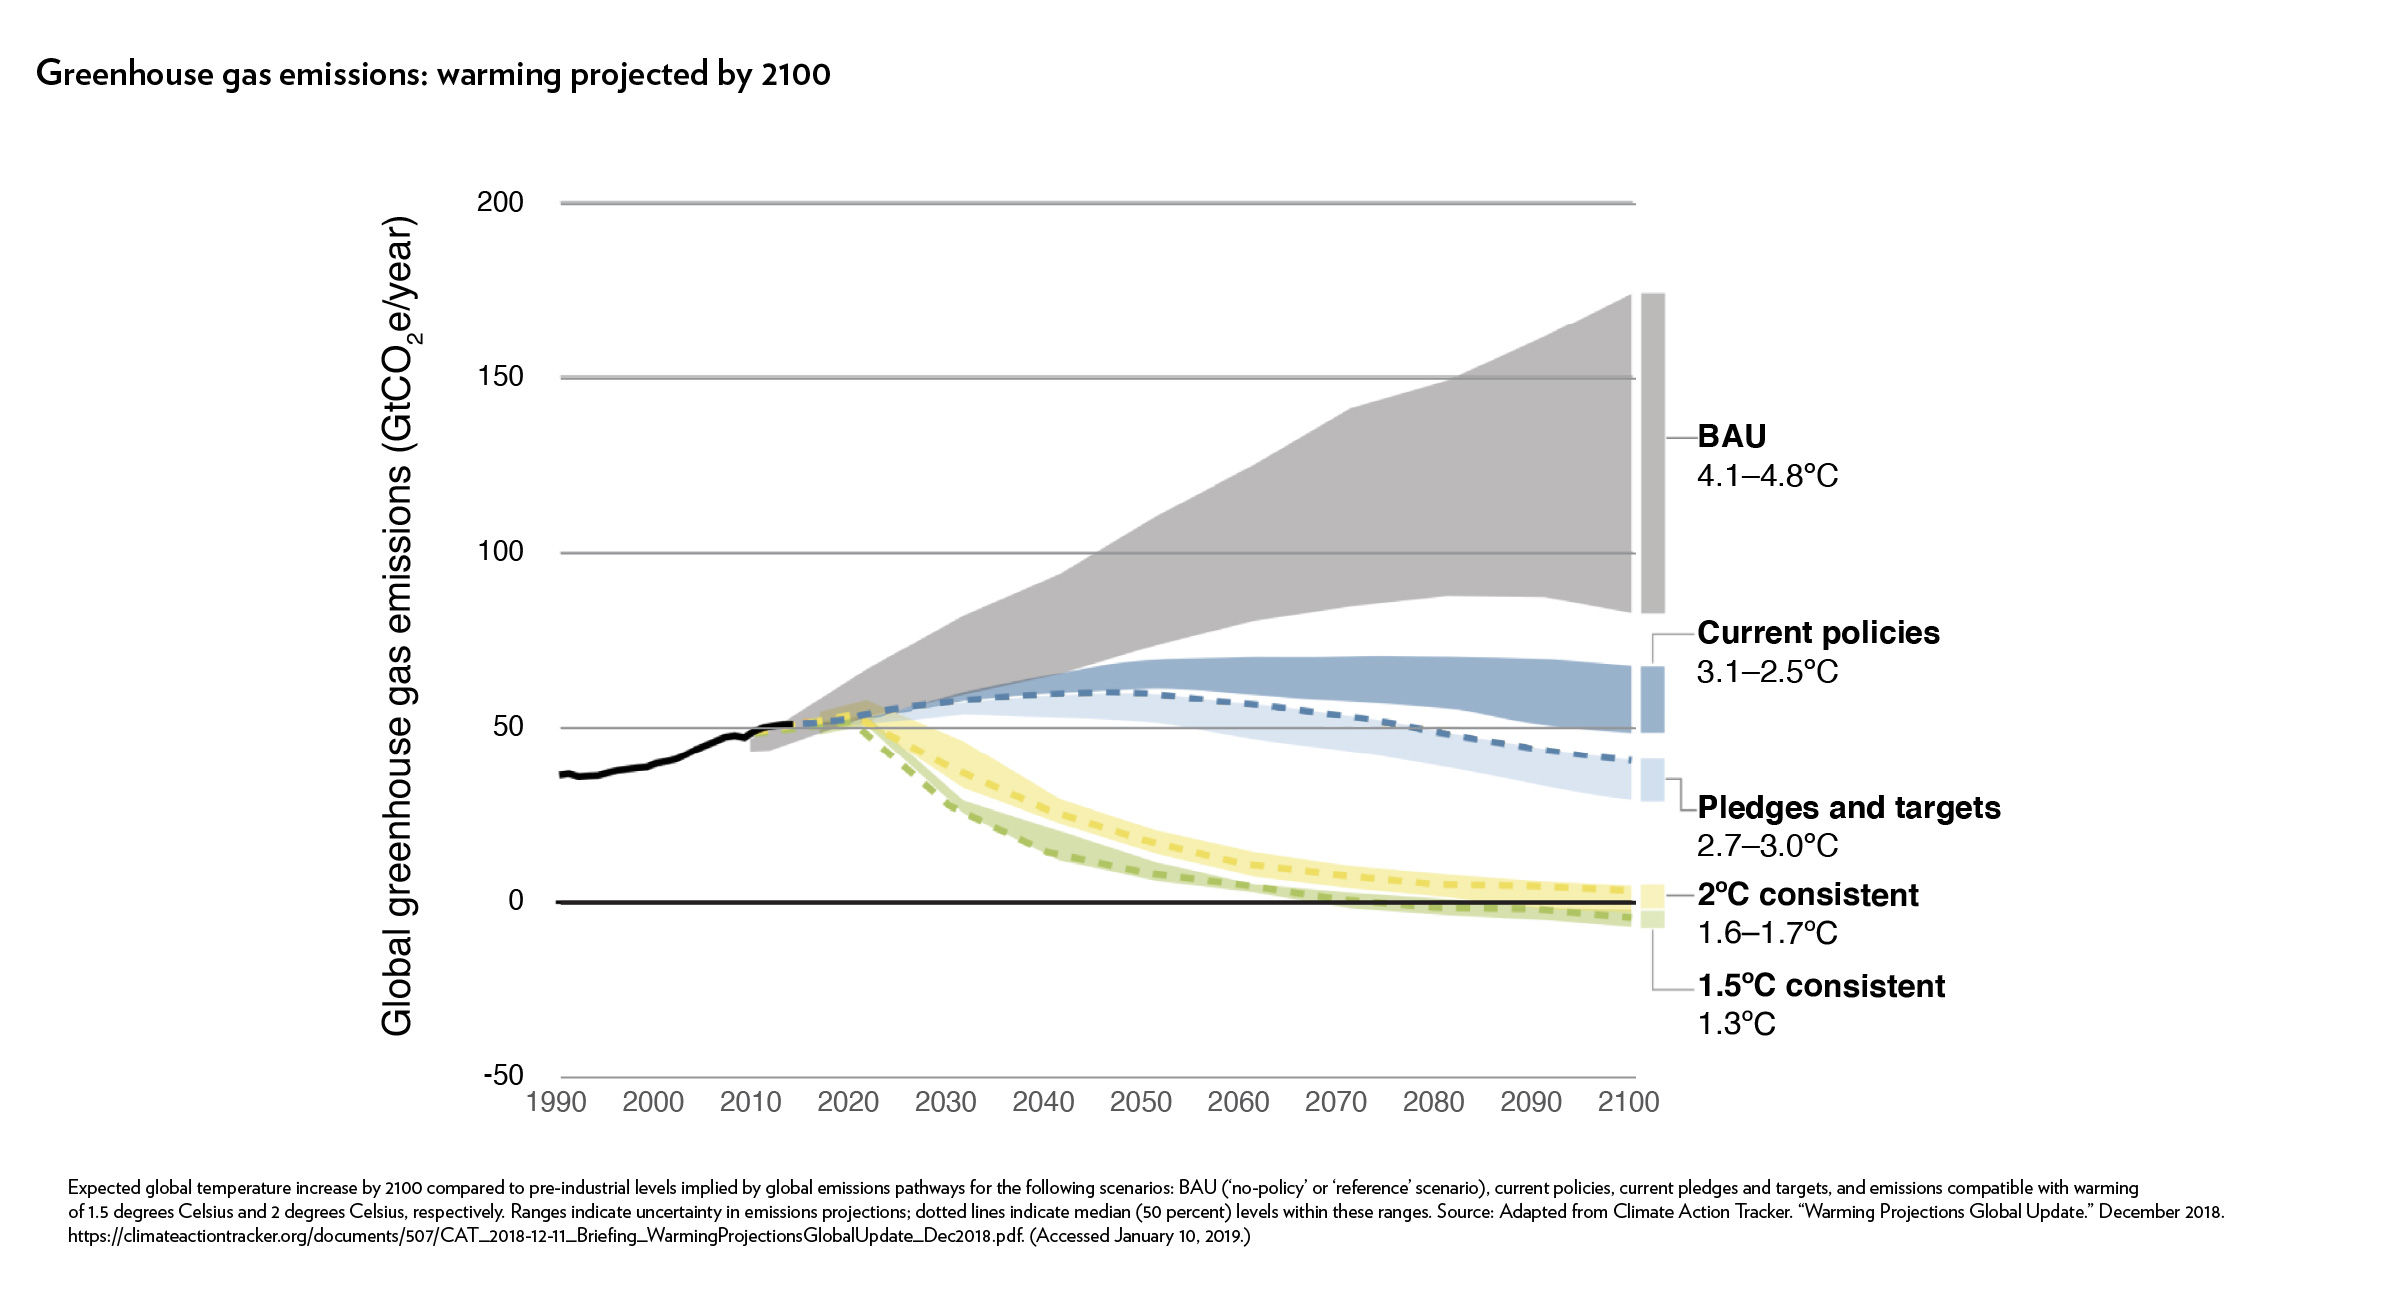
Global greenhouse gas (GHG) emissions currently show no signs of peaking.7 Current policies are expected to lead to warming of 3.3 degrees Celsius by 2100; under business-as-usual (a no-policy scenario), warming is projected to reach over 4 degrees Celsius by 2100.8 The Paris Agreement put forth a target of limiting global warming to 2 degrees Celsius compared to pre-industrial levels by 2100, and to “pursue efforts” to limit warming to 1.5 degrees Celsius. At current rates of warming, it is projected that the world will reach the 1.5-degree threshold between 2030 and 2052.
Greenhouse gas emissions: warming projected by 2100
Expected global temperature increase by 2100 compared to pre-industrial levels implied by global emissions pathways for the following scenarios: BAU (‘no-policy’ or ‘reference’ scenario), current policies, current pledges and targets, and emissions compatible with warming of 1.5 degrees Celsius and 2 degrees Celsius, respectively. Ranges indicate uncertainty in emissions projections; dotted lines indicate median (50 percent) levels within these ranges. Source: Adapted from Climate Action Tracker. “Warming Projections Global Update.” December 2018. https://climateactiontracker.org/documents/507/CAT_2018-12-11_Briefing_WarmingProjectionsGlobalUpdate_Dec2018.pdf. (Accessed January 10, 2019.)
Ocean heat content
The year 2019 set a new record of ocean heating, surpassing 2018 as the warmest year on record for ocean heat content.9 The past five years (2015 to 2019) have ranked as the five warmest years for ocean heat content, confirming a trend that ocean warming has been accelerating since the 1990s.10 New research suggests that the rate of ocean warming is much faster than previously predicted. A series of analyses indicate that the ocean is absorbing excess heat 40 percent faster than the Intergovernmental Panel on Climate Change (IPCC) estimated in its Fifth Assessment Report in 2013.11 This signifies that global warming may be more advanced than previously thought, potentially leaving the world less time to reduce emissions in order to meet global targets.
Ocean heat content is among the best—if not the best—indicator for climate change, given that the ocean stores the bulk of excess global warming heat.12 For this reason, it is easier to use ocean heat content to detect the “fingerprint” of human influence on the climate, as opposed to the atmosphere which is more prone to year-to-year natural variability. The majority of heat (65 percent) has accumulated in the top 700 meters of the ocean; most of the remainder has accumulated in depths of 700 to 2000 meters.
Global ocean heat content
Ocean acidification
As the ocean absorbs gigatons of the excess CO2 that humans produce every year, seawater has become increasingly acidic. The rate of acidification is unparalleled in the past 66 million years.13 Changing ocean chemistry has substantial implications for marine food webs. For instance, ocean acidification, combined with rising temperatures, are making it more difficult for shellfish—including oysters, mussels, abalone, and pteropods—to form their shells. Shifts in the food web due to acidification and other climate stressors are already altering productivity and typical species interactions.14
Sea surface temperature
The average global sea surface temperature—the temperature from the upper few meters of the ocean—has risen about 0.12 degrees Celsius per decade over the past 50 years, with a higher rate of warming in recent years.15 These higher temperatures are contributing to: mass bleaching of coral reefs, die offs of other ecosystems with low thermal sensitivity (such as kelp and intertidal communities), shifts in fisheries stocks due to temperature, a reduction in algae productivity, and more frequent and intense extreme weather events.16
Global ocean temp. anomaly
For coral reefs, for instance, increased sea temperature has contributed to more frequent bleaching events in recent years: globally, the annual risk of bleaching has increased from 8 percent in the early 1980s to 31 percent in 2016.17 The time between recurrent events has also become too short to allow sufficient time for recovery.18 Whereas the time between recurrent severe bleaching events was 27 years in the early 1980s, this window is now only 6 years.19 (Typically it takes 10 to 15 years for the fastest-growing corals to recover from a severe bleaching event.)
Cumulative bleaching on the Great Barrier Reef
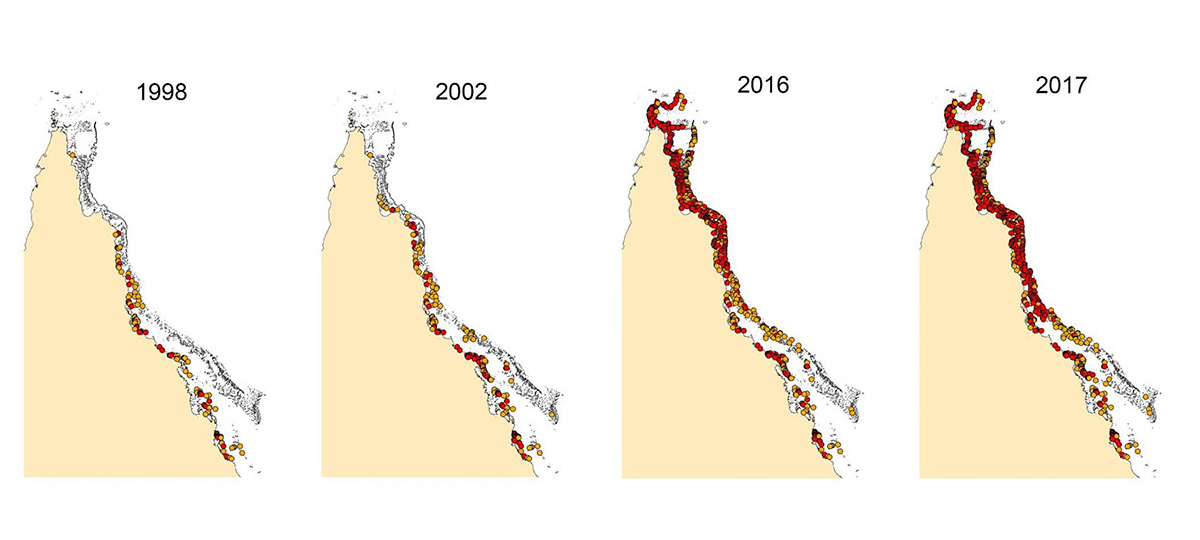
Each dot represents the most severe bleaching score recorded from 1998 to 2017 on individual reefs following each of four major beaching events, in 1998, 2002, 2016 and 2017. Successive maps include earlier bleaching records to illustrate the expanding cumulative footprint through time. Red (>60% of colonies bleached); Orange (30 to 60 percent). Source: Hughes, T., J.T. Kerry, S.R. Connolly, A.H. Baird, C.M. Eakin, S.F. Heron, A. Hoey, M. Hoogenboom, M. Jacobson, G. Liu, M.S. Pratchett, W. Skirving, and G. Torda. “Ecological memory modifies the cumulative impact of recurrent climate extremes.” Nature Climate Change 9 (2018). doi.10.1038/s41558-018-0351.
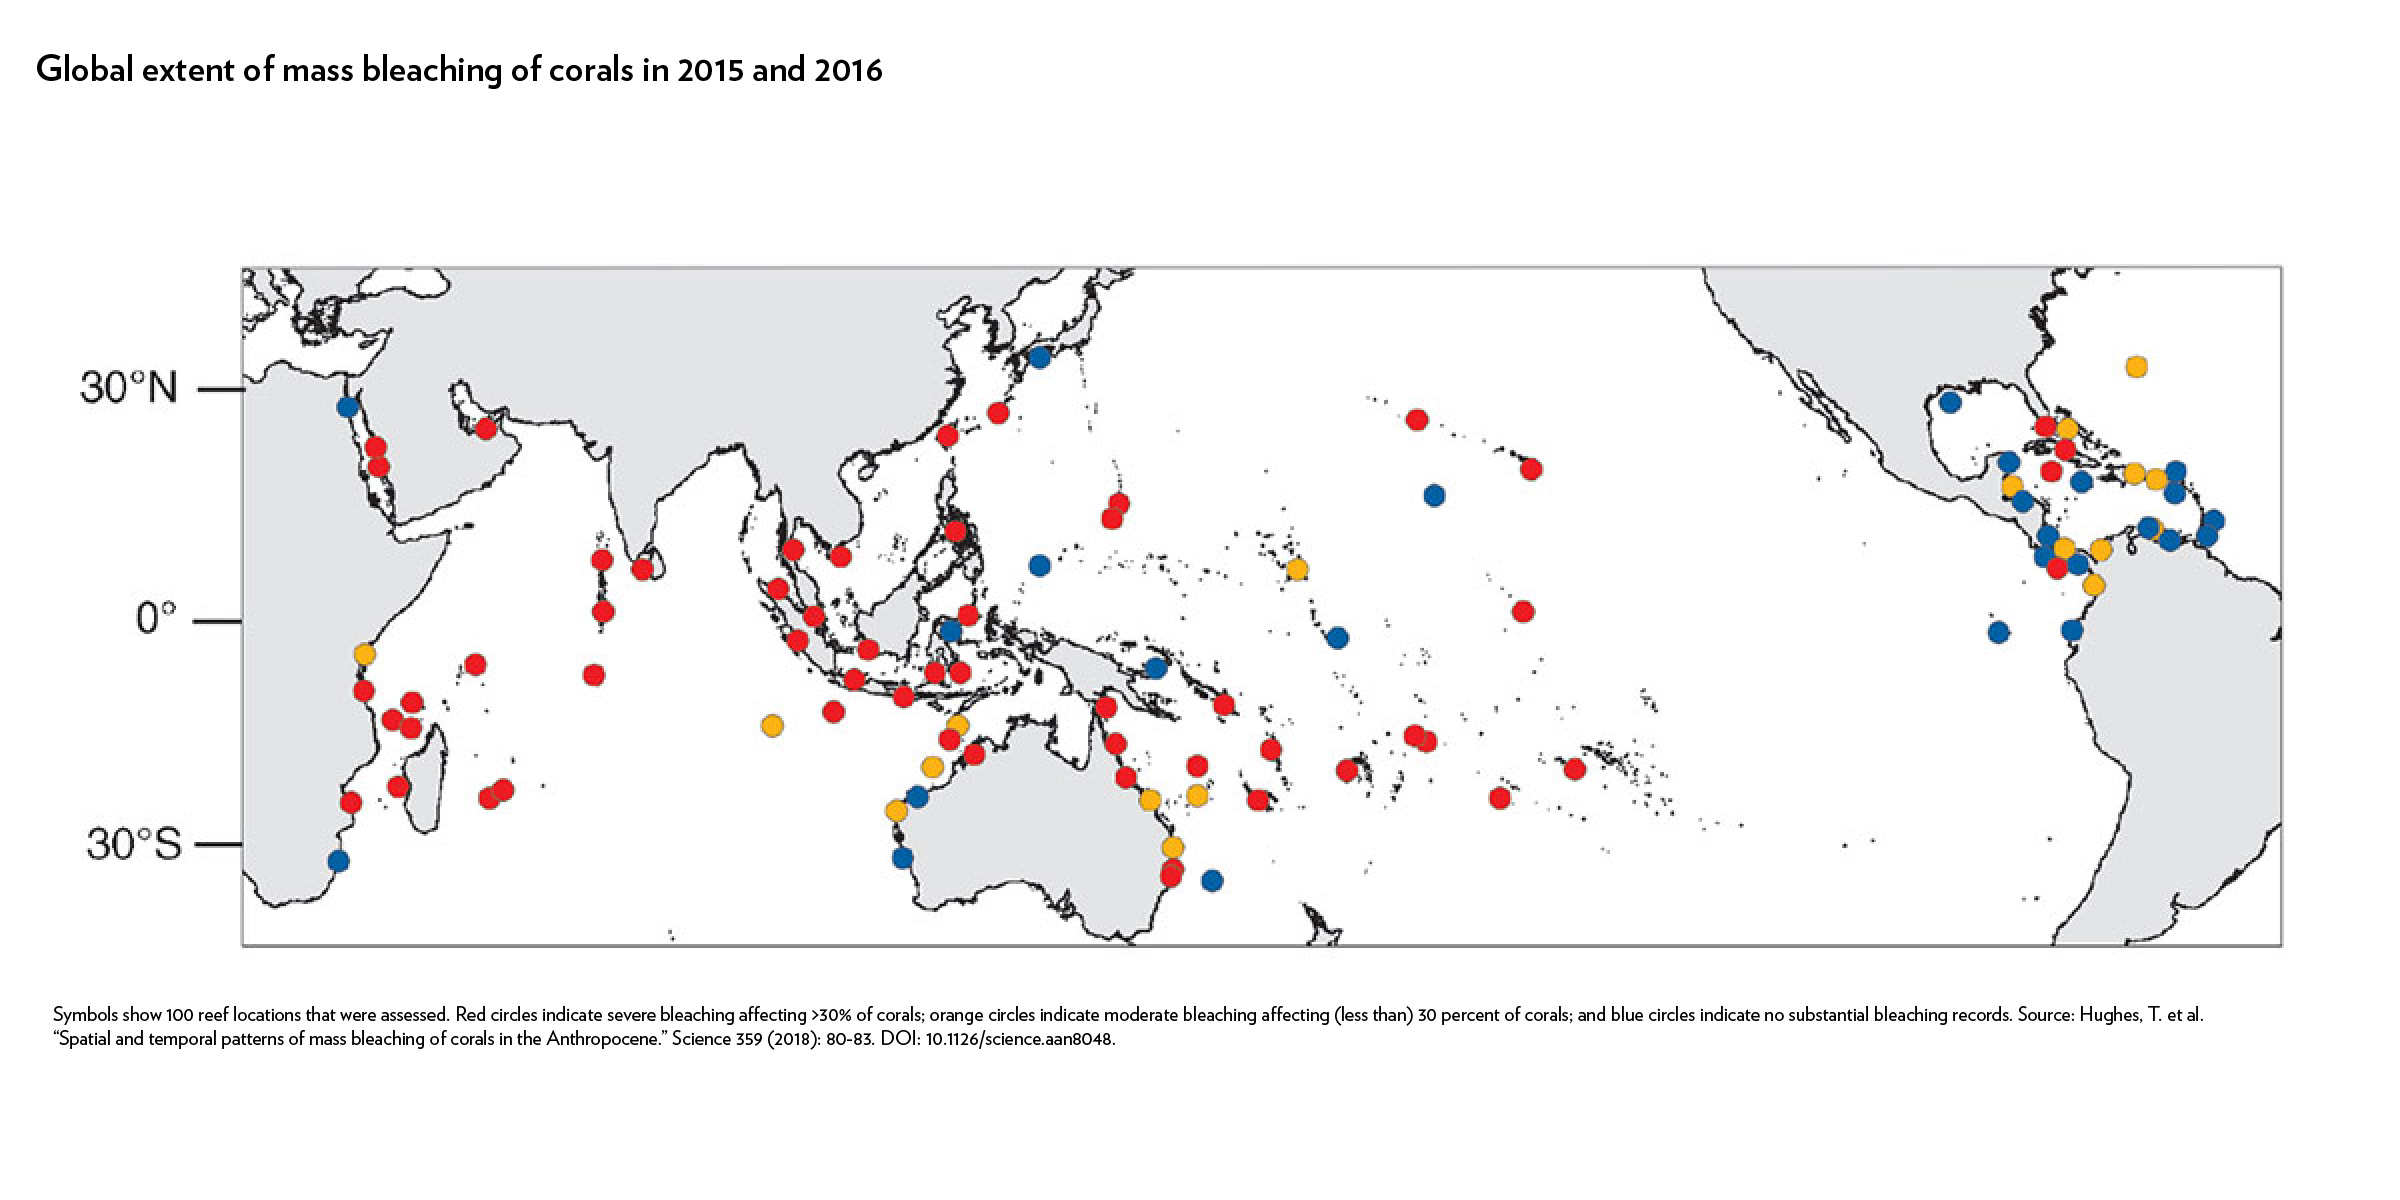
Mass coral bleaching has been one of the most tangible indicators of anthropogenic global warming, as coral reefs are particularly sensitive to thermal stress.20 An estimated 30 to 60 percent of coral reefs have died since preindustrial times. Even if the goals of the Paris Climate Agreement are achieved (of limiting temperature to below 2 degrees Celsius), roughly 70 to 90 percent of current distribution of coral reef habitat will disappear by 2050.21 A failure to achieve the Paris Agreement will result in a near total loss of coral reefs by mid-century.22 These impacts will ripple through both natural and human communities: coral reefs serve as incubators for roughly 25 percent of all marine fish species, supporting fish stocks that provide food for more than one billion people.23
Global extent of mass bleaching of corals in 2015 and 2016
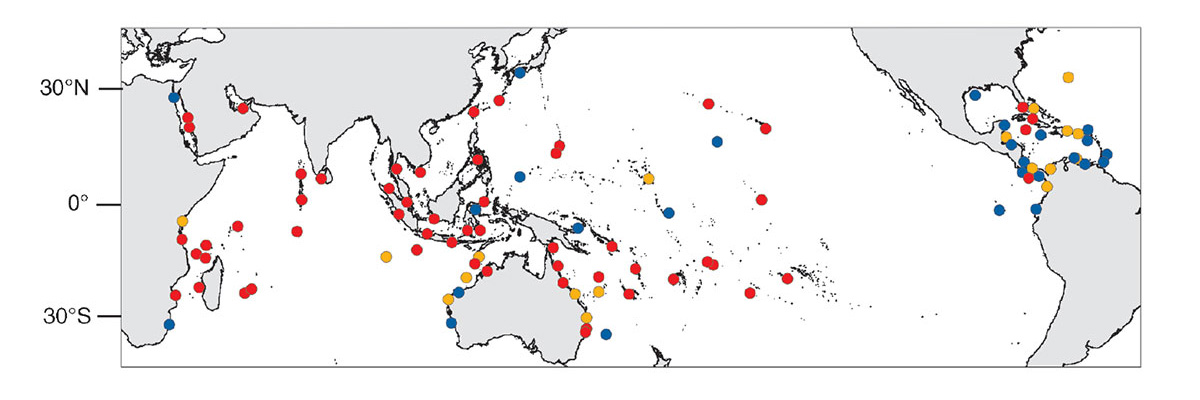
Symbols show 100 reef locations that were assessed. Red circles indicate severe bleaching affecting >30% of corals; orange circles indicate moderate bleaching affecting (less than) 30 percent of corals; and blue circles indicate no substantial bleaching records. Source: Hughes, T. et al. “Spatial and temporal patterns of mass bleaching of corals in the Anthropocene.” Science 359 (2018): 80-83. DOI: 10.1126/science.aan8048.
Sea-level rise
The global sea level has been rising over the past century, though the rate of change has accelerated in recent decades. The rate of global sea-level rise nearly doubled from 1.7 mm annually throughout most of the twentieth century to 3.1 mm (0.12 inch) per year since 1993.24 A global modeling analysis suggests that a 50-centimeter sea-level rise by 2100 would result in a loss of roughly 50 percent of coastal wetlands across the planet.25 The impacts of sea-level rise holds consequence for both natural and human communities as structured coastal ecosystems (including coral reefs, saltmarshes, mangroves, and seagrasses) currently reduce wave height by an estimated 30-90 percent.26 At least 40 percent of the global population lives in coastal areas which are vulnerable to rising seas.
About one-third of the rise in global sea level has been caused by the thermal expansion of water.27 The increase in ocean heat in 2018 led to a 29.5 millimeter (1.2 inches) global mean sea-level rise above the 1981–2010 average.28 Sea-level rise is further exacerbated by melting of ice sheets in the polar regions.
Global sea level change
Ice melt and changes in the Arctic
Warming air and ocean temperatures are continuing to accelerate change across the polar regions. A recent study found that the Arctic surface temperatures have been warming at twice the rate as the rest of the planet for the past 50 years.29 The Arctic has been warmer over the last five years than at any other time since records began in 1900.30 This warming has led to dramatic reductions in sea ice thickness and extent, as well as accelerated melting of glaciers.
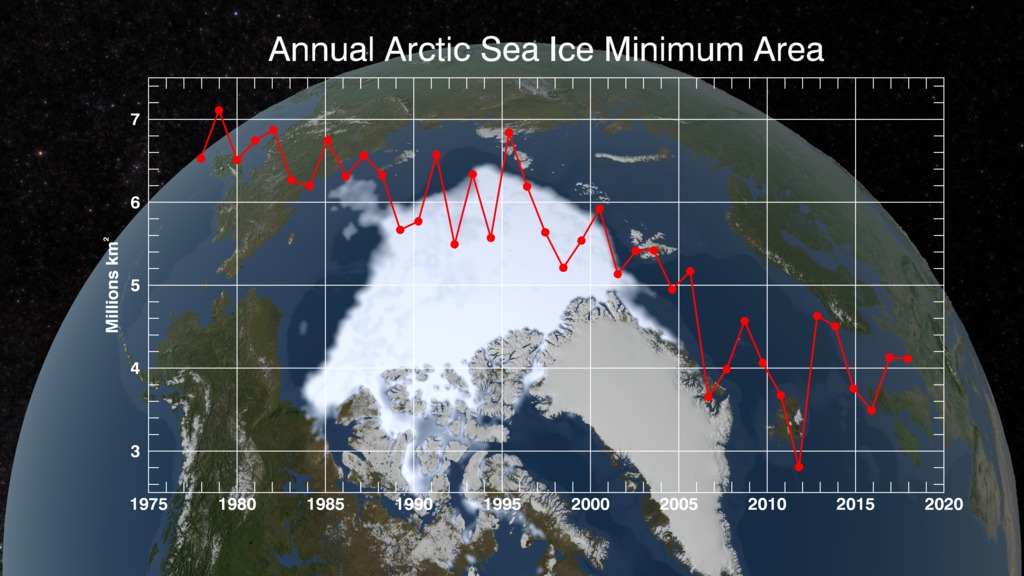
The 2018 Arctic Report Card, a peer-reviewed report that provides an annual status update on the region, found that the Arctic experienced the second-lowest overall sea-ice coverage ever recorded; the lowest-recorded winter ice in the Bering Sea; the second-warmest air temperatures; and earlier plankton blooms due to early melting of sea ice in the Bering Sea.31
Arctic Sea Ice Minimum, 1979–2018
Source: NASA/Goddard Space Flight Center Scientific Visualization Studio The Blue Marble data is courtesy of Reto Stockli (NASA/GSFC). Acquired from https://svs.gsfc.nasa.gov/4686.
Changes in the Arctic atmosphere and ocean—described by a NOAA scientist as the region’s “most unprecedented transition in history”32—are a barometer for the rest of the planet. A recent study on ice loss in Antarctica found that the continent is contributing more to global sea level than previously estimated. Since 2012, the amount of ice loss per year has tripled, increasing the global sea level by 3 millimeters (0.12 inch).33
By 2100, global sea level could rise 65 centimeters (21 inches) if the rate of sea-level rise continues to accelerate at the observed rate; ice melt from Antarctica could account for nearly 25 percent of this rise.34 This scale of change would cause significant problems for coastal areas. In Brooklyn, for instance, which typically floods about once a year, this amount of sea-level rise would cause flooding about 20 times a year.35
Antarctic ice sheet contribution to global sea level
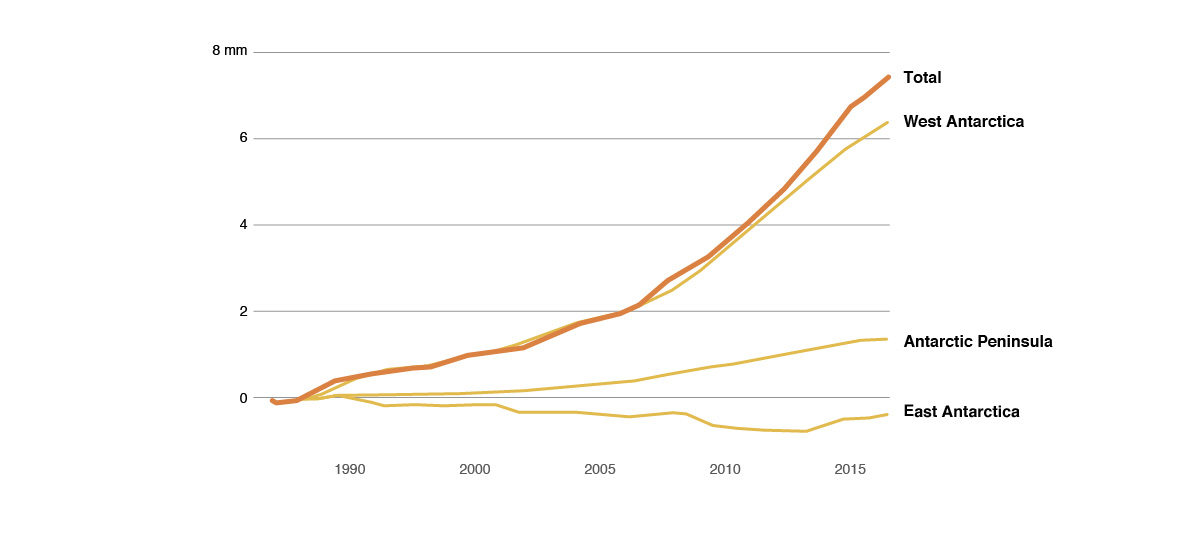
Adapted from Changes in the Antarctic ice sheet’s contribution to global sea level, 1992 to 2017. Credit: IMBIE/Planetary Visions. Source: NASA. “Ramp-up in Antarctic ice loss speeds sea-level rise.” June 13, 2018, https://climate.nasa.gov/news/2749/ramp-up-in-antarctic-ice-loss-speeds-sea-level-rise/.
As Arctic waters warm and become increasingly ice-free, new implications are emerging for the rest of the world—from climatic and environmental impacts to geopolitical and commercial considerations. Growing scientific evidence has linked the loss of land and sea ice in the Arctic, and associated interference in the thermohaline circulation, to extreme weather events over the northern hemisphere—from severe winter storms in the eastern United States in 2018 to the intense cold wave in Europe in March 2018.36
Some industries—such as shipping and oil and gas—see new opportunities for commercial expansion in the Arctic, with unknown consequences for the region’s fragile environment. In September 2018, the container ship Venta Maersk became the first container ship to traverse the Arctic Ocean via the Northern Sea Route. Meanwhile, scientists are working to better understand how climate change is upending the region’s food web and what it might mean for the future, from phytoplankton to polar bear populations.37
At a macro level, there is a current lack of scientific understanding as to self-reinforcing feedback loops and the “known unknown” of tipping points, which represent critical thresholds beyond which the impacts of rapid climate change become difficult to reverse. A recent study suggested that Greenland’s massive ice sheet is melting four times faster than previously thought, and it may be approaching a dangerous tipping point, with serious implications for global sea-level rise within the next two decades.38
Shifting distribution of marine species
As waters warm due to climate change, fish and other marine species are migrating into new territory, usually poleward, at a rate averaging 70 km (43 mi) per decade.39 For example, in the U.S. Atlantic, three commercially important species—American lobster, red hake, and black seabass—moved northward by an average of 190 km (119 mi) between 1982 and 2015.40 These shifts are expected to continue or accelerate in the future.41
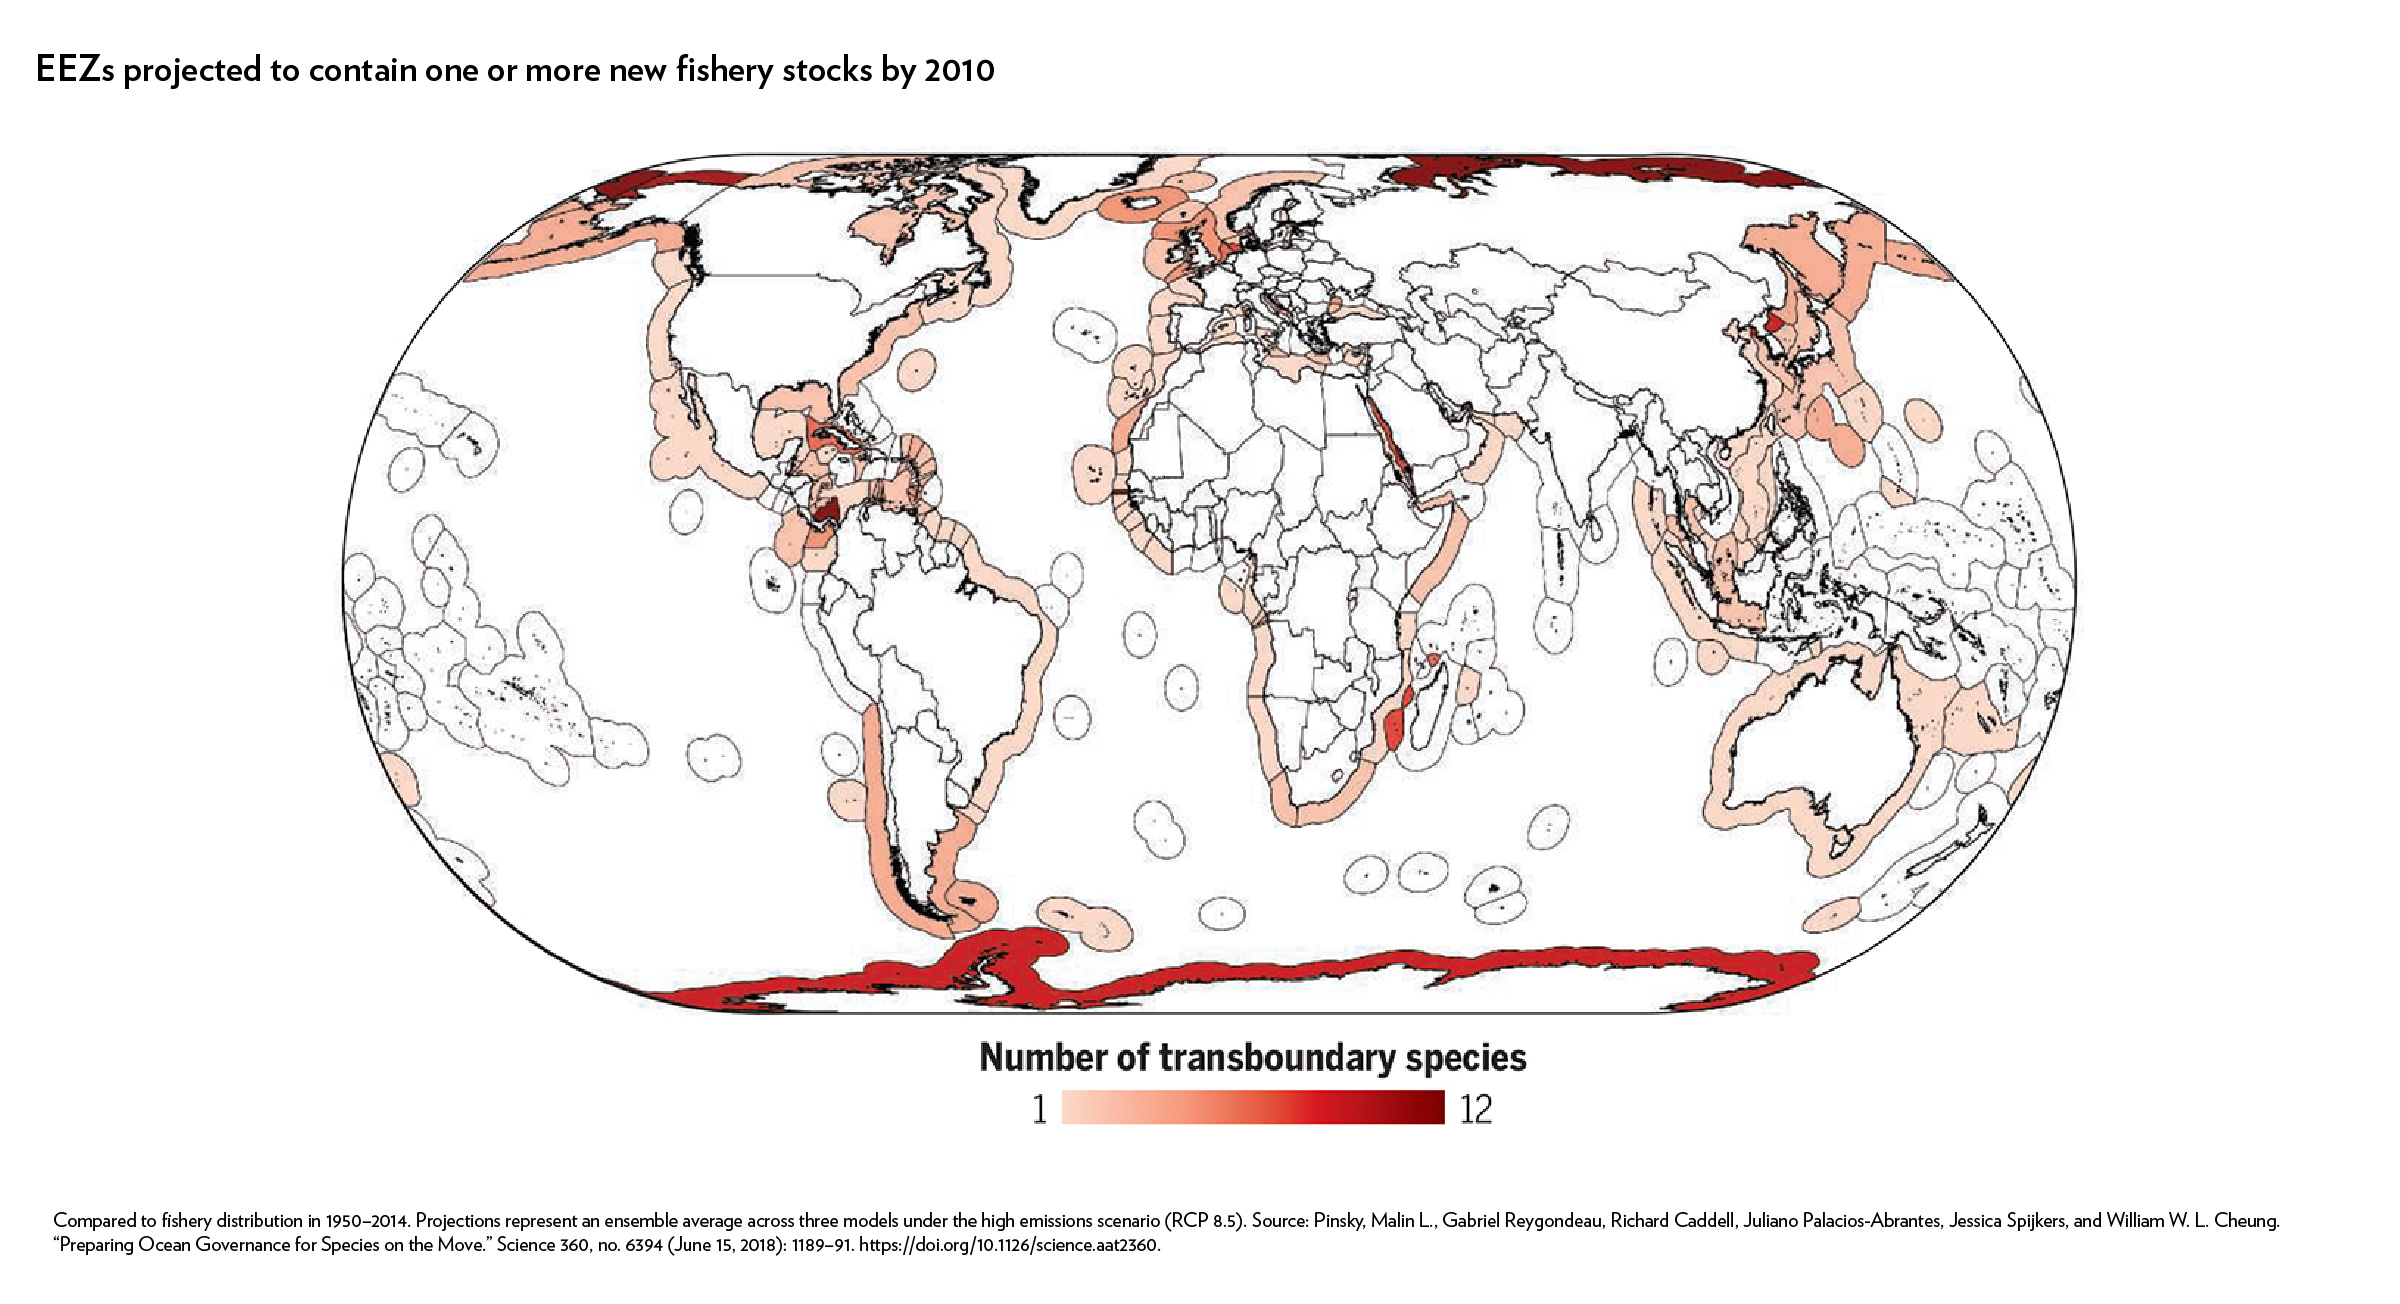
Shifting stocks creates a challenge for fisheries governance given that current fisheries management lacks “future-proofing” policies to account for fluctuating or changing distributions of marine species. One study projected that new transboundary stocks will be present in roughly 30 percent of global EEZs by 2100.42 Stocks that straddle national boundaries may experience a scenario of “double jeopardy,” facing unsustainable competitive harvesting from multiple countries.
EEZs projected to contain one or more new fishery stocks by 2100
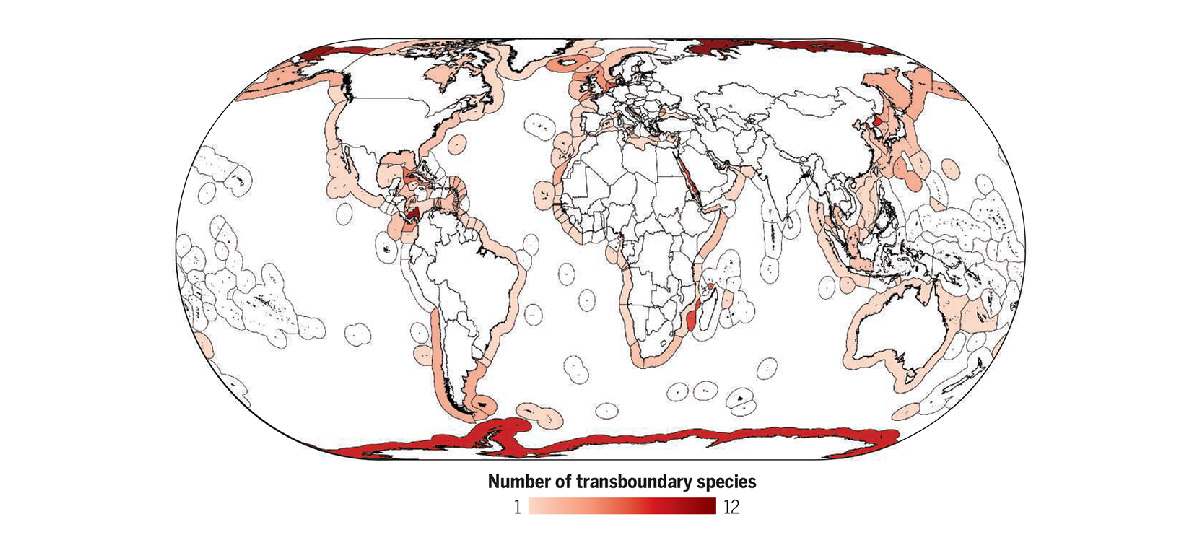
Compared to fishery distribution in 1950–2014. Projections represent an ensemble average across three models under the high emissions scenario (RCP 8.5). Source: Pinsky, Malin L., Gabriel Reygondeau, Richard Caddell, Juliano Palacios-Abrantes, Jessica Spijkers, and William W. L. Cheung. “Preparing Ocean Governance for Species on the Move.” Science 360, no. 6394 (June 15, 2018): 1189–91. https://doi.org/10.1126/science.aat2360.
Emissions contribution of marine industries
Certain marine industries—including shipping, oil and gas, and fishing—carry a carbon footprint which has been growing in recent years but is rarely focused on in global climate negotiations and greenhouse gas assessments.43 The shipping industry accounts for about 3 percent of global emissions; under a “business as usual (BAU)” scenario, it is projected that it could account for as much as a fifth of emissions by 2050.44
Despite the shipping sector’s contribution to global emissions, it was originally excluded in the Paris Agreement in 2015. The International Maritime Organization announced in 2018 that the shipping industry would cut its emissions in half by 2050.45 This level falls short of reaching Paris Agreement targets; however, certain industry leaders may pursue independent initiatives to accelerate the transition to commercially-viable carbon neutral vessels. In late 2018, for instance, Maersk announced a goal to reach carbon neutrality by 2050.46
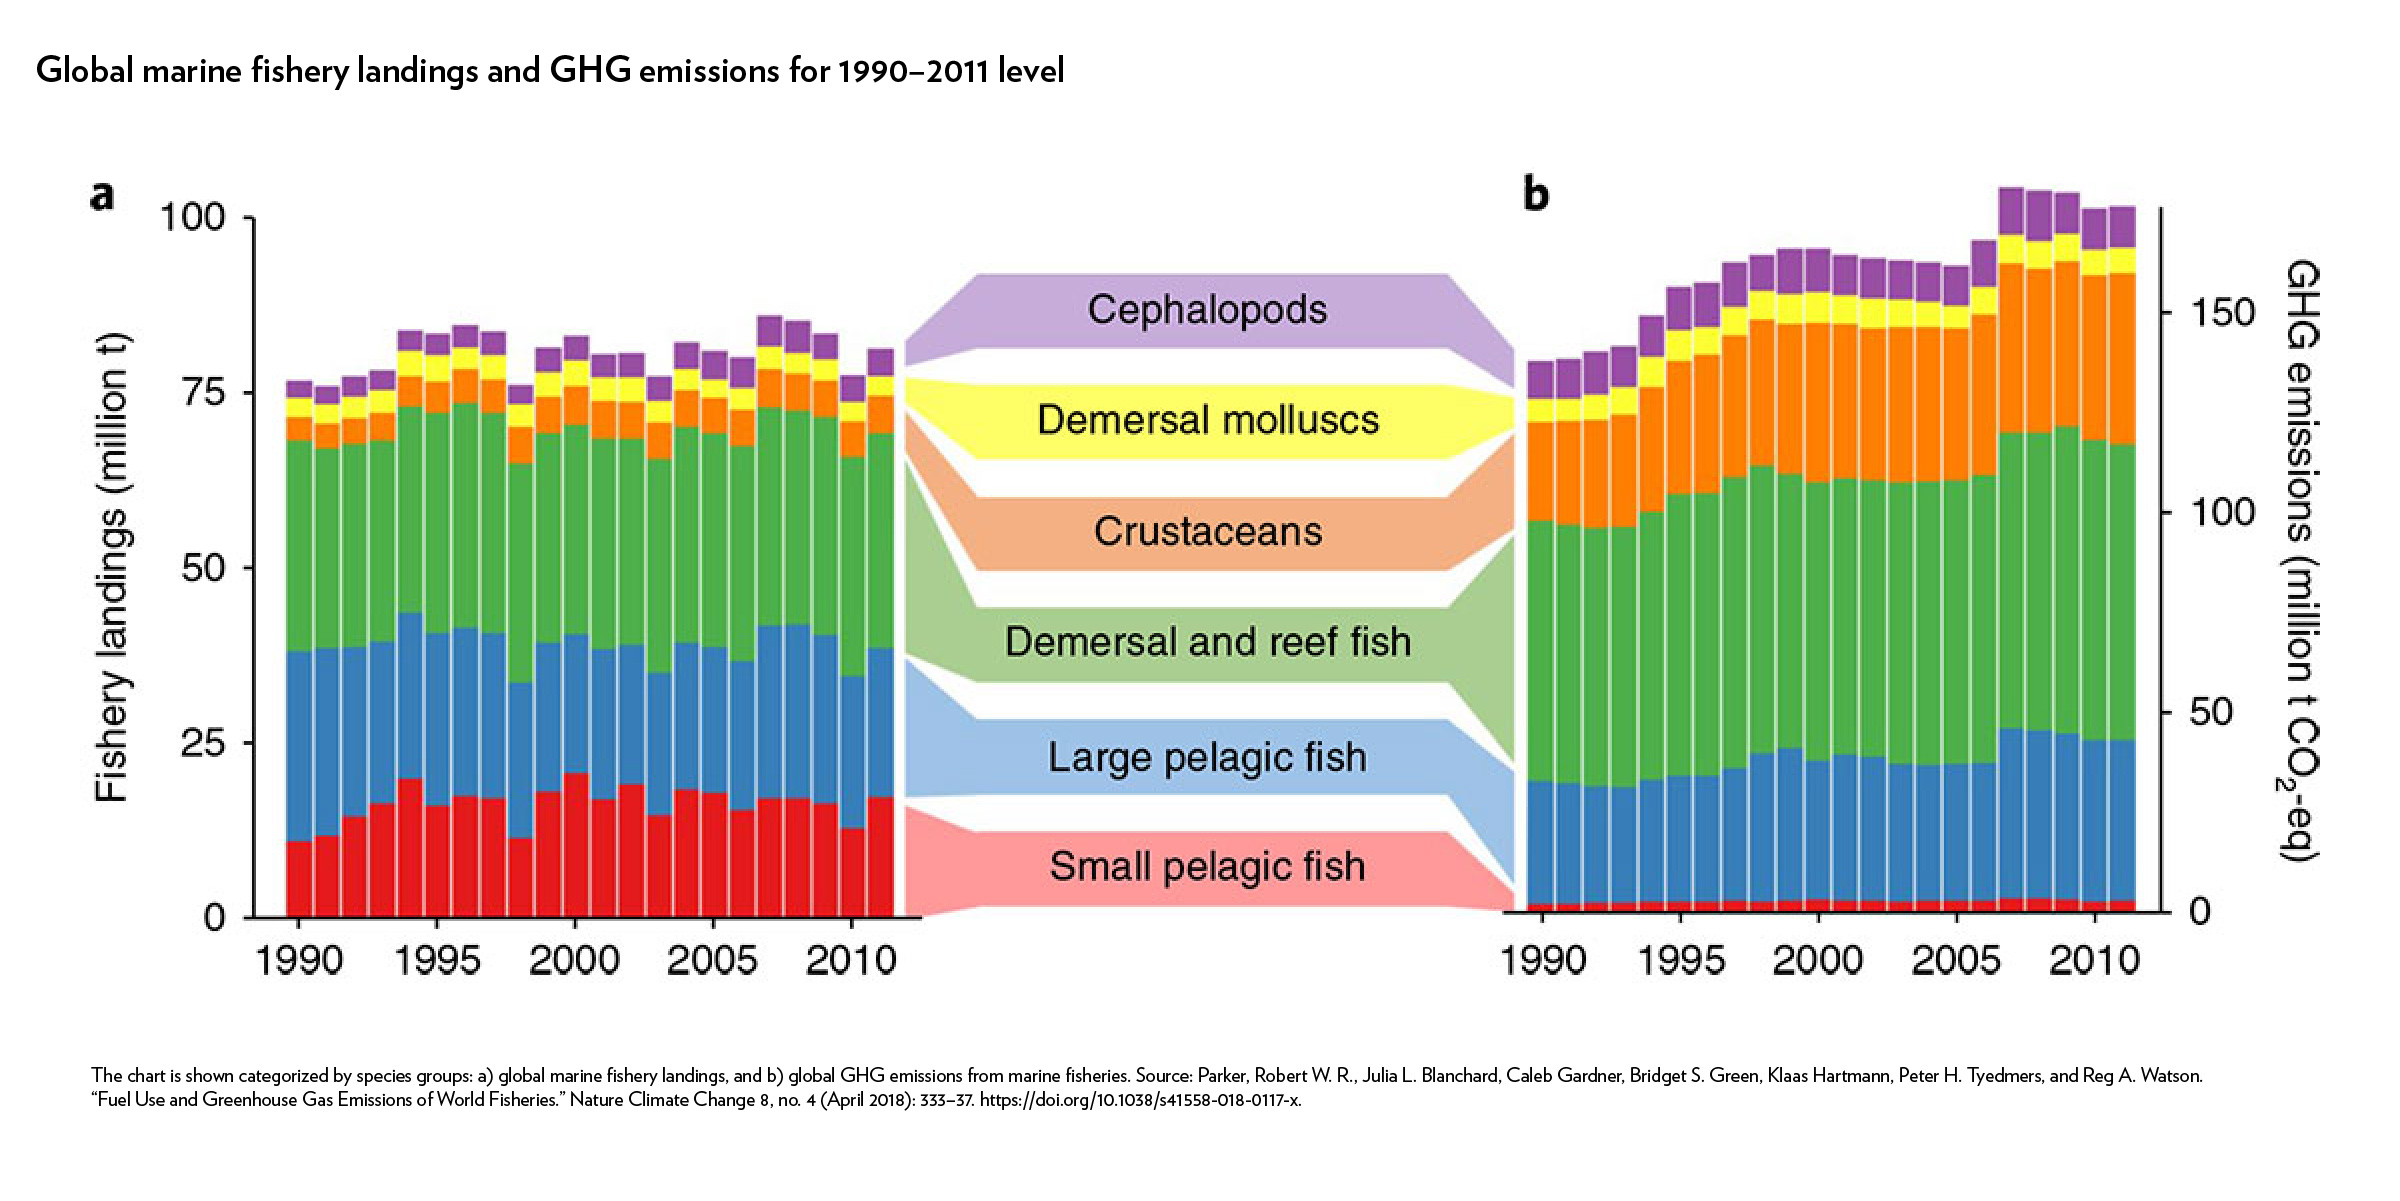
Emissions from the global fishing industry increased by 28 percent between 1990 and 201147 while average emissions per ton of landed seafood product grew by 21 percent during this time period.48 Increased harvest from fuel-intensive crustacean fisheries primarily drove this growth in emissions. Capacity-enhancing fuel subsidies and growth in distant water fishing have also contributed to the fishing sector’s trend of increased emissions.
Global marine fishery landings and GHG emissions for 1990–2011 level
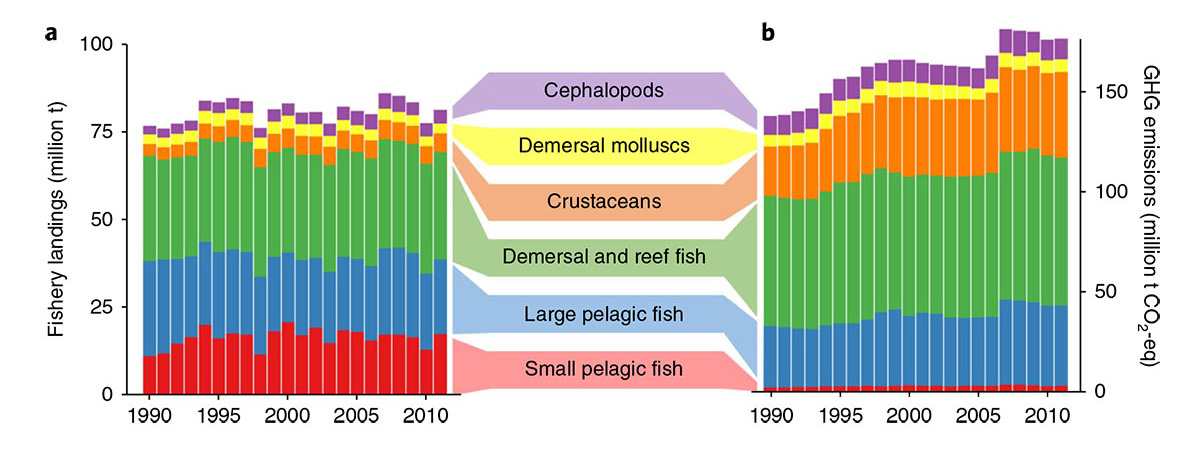
The chart is shown categorized by species groups: a) global marine fishery landings, and b) global GHG emissions from marine fisheries. Source: Parker, Robert W. R., Julia L. Blanchard, Caleb Gardner, Bridget S. Green, Klaas Hartmann, Peter H. Tyedmers, and Reg A. Watson. “Fuel Use and Greenhouse Gas Emissions of World Fisheries.” Nature Climate Change 8, no. 4 (April 2018): 333–37. https://doi.org/10.1038/s41558-018-0117-x.
A 1.5-degree versus 2-degree Celsius future
Scientific consensus indicates that the ocean will experience significantly more serious impacts under even the most optimistic emissions reduction scenario.49 In order to reach the Paris Agreement, GHG emissions in 2030 need to be approximately 25 percent lower than in 2017—which is technically still feasible—to put the world on a least-cost pathway to limiting global warming to 2 degrees Celsius (and 55 percent lower to limit warming to 1.5 degrees Celsius).50
A major IPCC report examined the consequences of a future with warming of 1.5 or 2 degrees Celsius.51 While both scenarios would heavily impact the ocean, the report outlines that a half degree of warming will lead to vastly different futures for natural and human communities. By 2100, Arctic summers could be ice-free once a decade in a world with 2 degrees of warming, or once a century under 1.5 degrees of warming. Nearly all of coral reefs could be irreversibly destroyed under 2 degrees of warming, or 10 to 30 percent may persist if warming is limited to 1.5 degrees Celsius. Marine fisheries catch may decrease at an annual rate of more than 3 million tonnes in a two-degree world, versus about 1.5 million tones in world with 1.5 degrees Celsius of warming.
Impacts associated with 1.5- and 2-degrees Celsius temperature increase
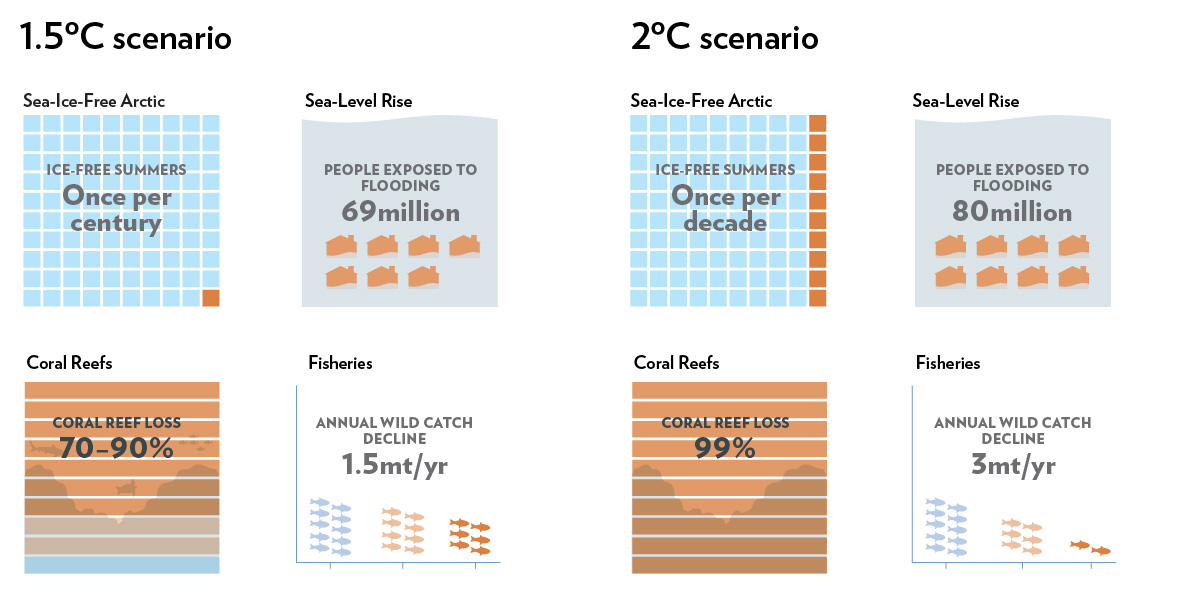
How much worse is a 2 degree Celsius scenario? For sea-ice-free Arctic summers it’s 900% worse. For populations exposed to flooding form sea-level rise it’s up to 15% worse. For cumulative decline in coral reefs, it’s 41% worse. For annual decline in wild fisheries catch it’s 50% worse.
Source: Adapted from IPCC. “Summary for Policymakers. In: Global Warming of 1.5°C. An IPCC Special Report on the impacts of global warming of 1.5°C above pre-industrial levels and related global greenhouse gas emission pathways, in the context of strengthening the global response to the threat of climate change, sustainable development, and efforts to eradicate poverty.” [Masson-Delmotte, V., et al. (eds.)]. World Meteorological Organization, Geneva, Switzerland, 2018, 32 pp.
Future climate and ocean conditions will be determined by how aggressively humanity pursues climate adaptation and mitigation options. Limiting global warming would allow natural and human communities time to adapt and increase the chance of remaining below critical risk thresholds. Although current pledges to reduce global emissions fall short of what is needed to achieve the goals of the Paris Agreement, the next few years present a decisive window for decarbonization. For instance, each five-year delay in reaching peak emissions could lead to an additional 20 centimeter rise in sea level over the long term, presenting high adaptation costs for coastal cities.52 The technical capacity is available to dramatically reduce GHG emissions across all sectors of the global economy—energy, food and agriculture, buildings, and transport—though the transformation would require unprecedented speed and scale to curtail the worst impacts of warming.53
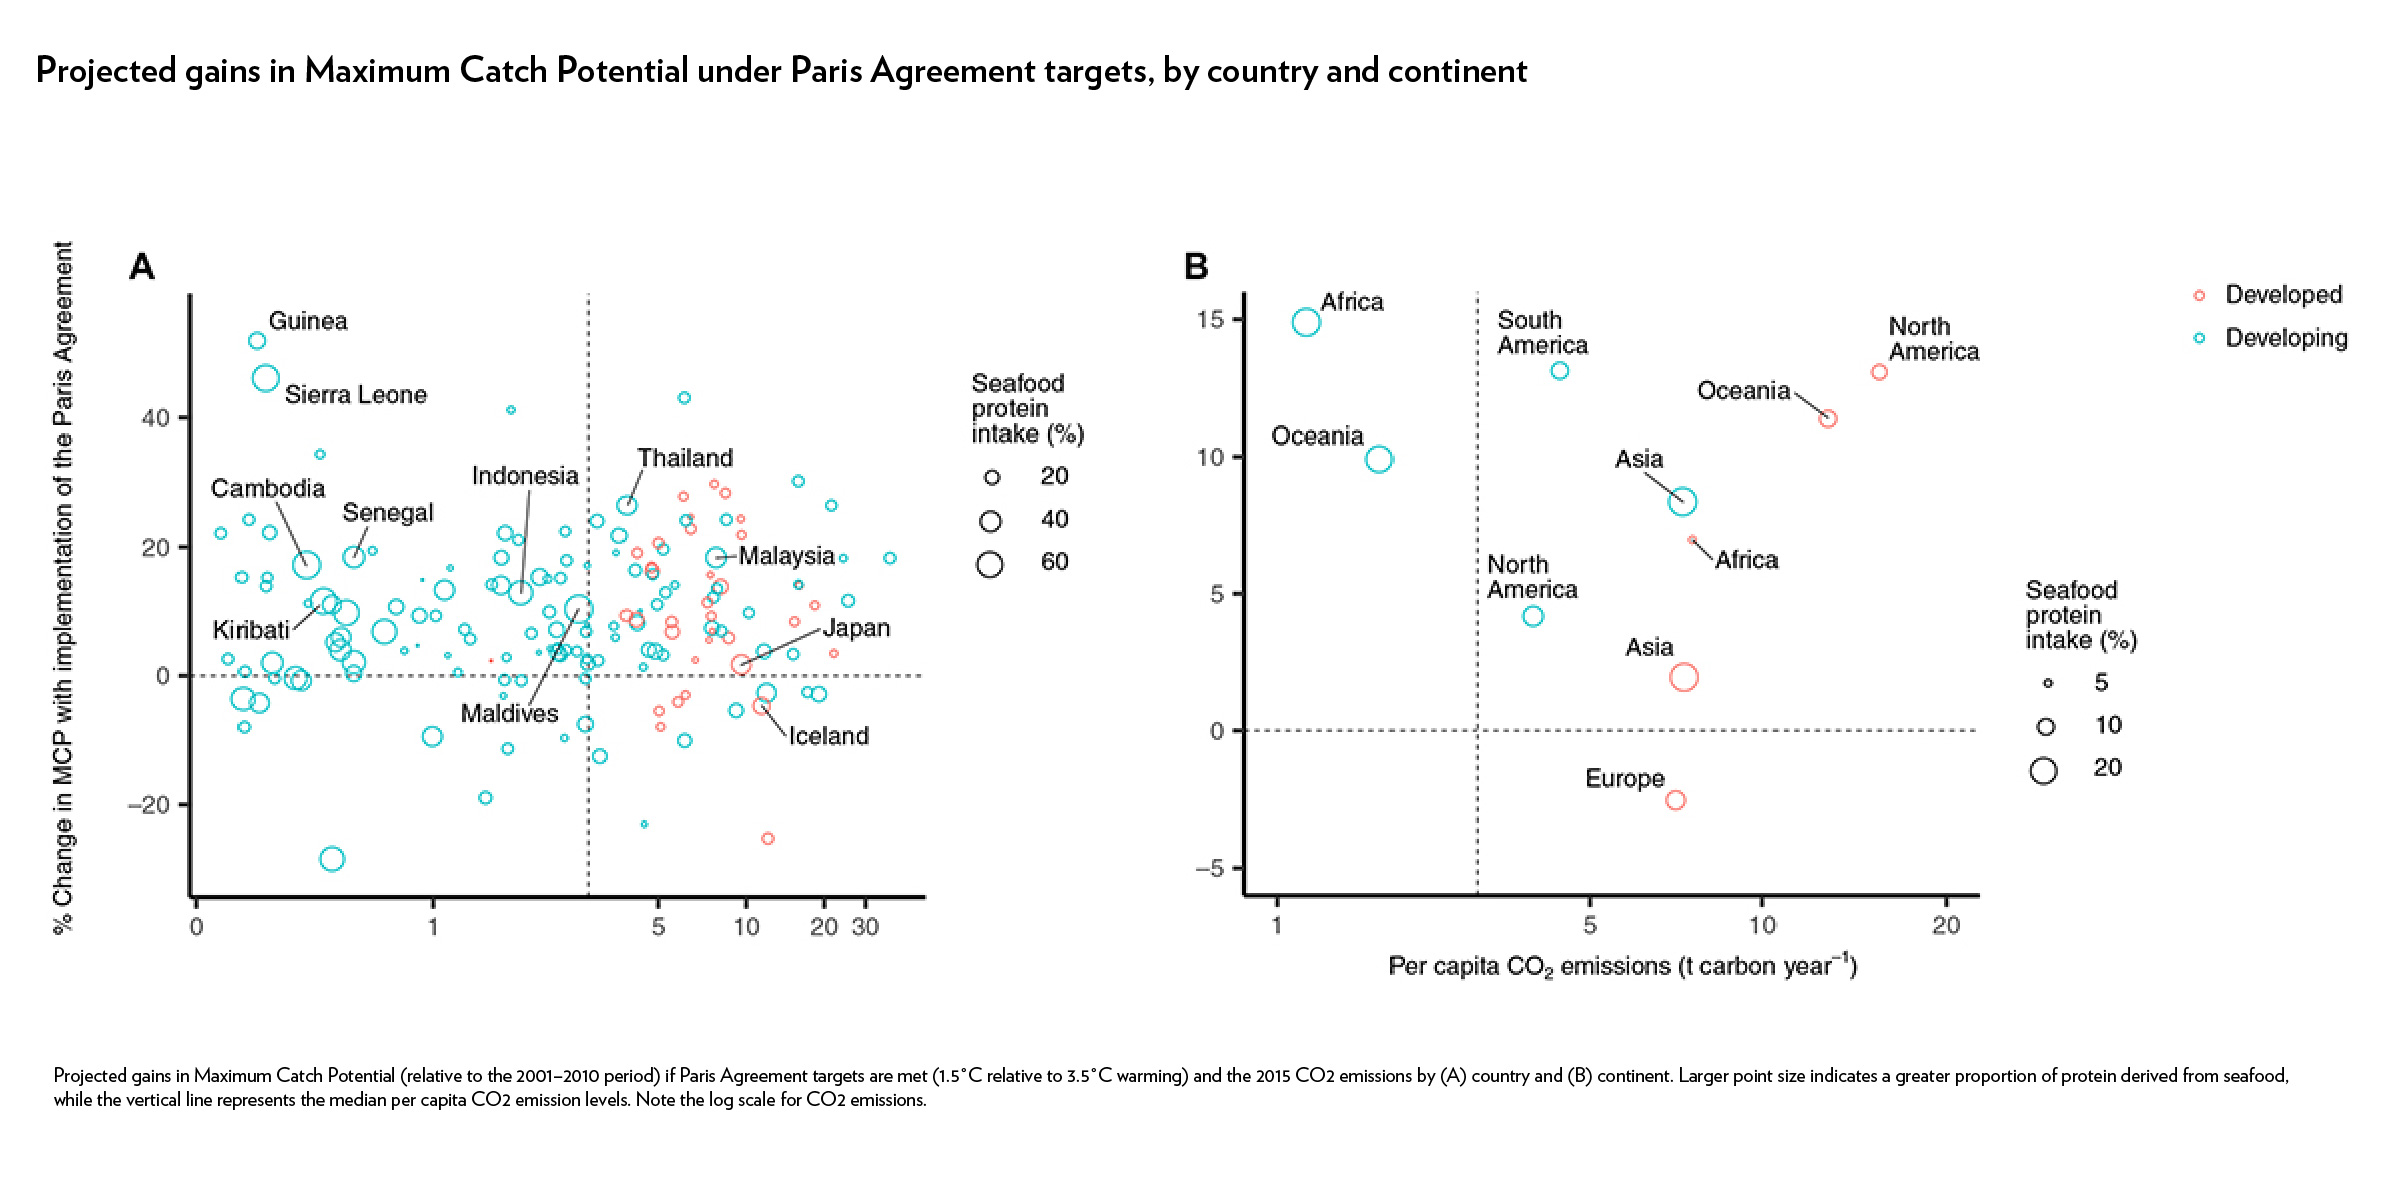
Moreover, new research suggests that as compared to a high-emissions scenario of 3.5 degrees Celsius, achieving the Paris Agreement would result in significant benefits for ocean productivity, economies, and human communities. The study found that limiting warming to 1.5°C could increase global fishers’ revenues by USD 13.1 billion annually (due to higher fish biomass and ocean productivity), raise seafood workers’ income by USD 10.6 billion, and reduce household seafood expenditures by USD 18.3 billion.54 The most significant gains would occur in developing countries, such as Kiribati, the Maldives, Indonesia, and other countries, which are most vulnerable to the impacts of warming temperatures and have the greatest reliance on fish for food security, incomes, and employment.
Projected gains in Maximum Catch Potential under Paris Agreement targets, by country and continent
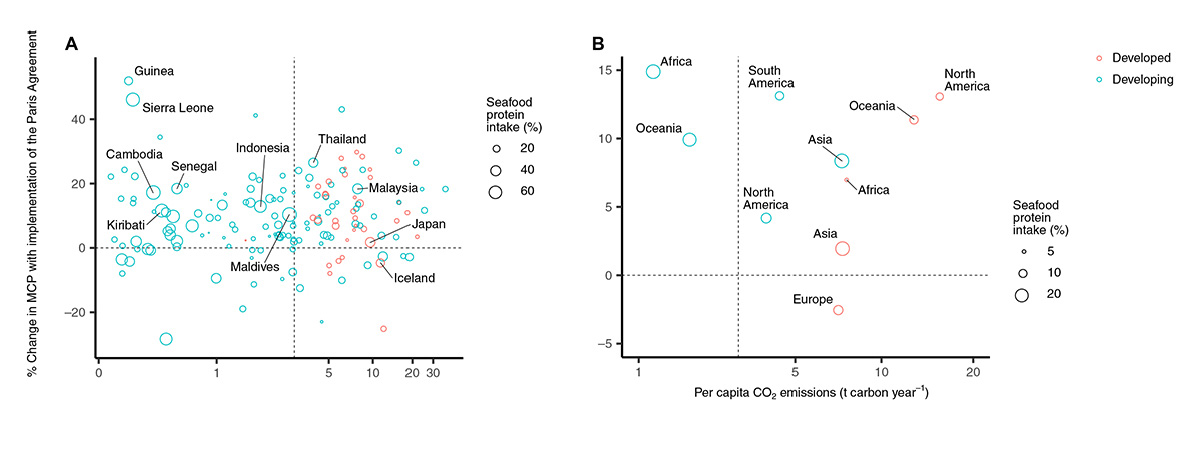
Projected gains in Maximum Catch Potential (relative to the 2001–2010 period) if Paris Agreement targets are met (1.5°C relative to 3.5°C warming) and the 2015 CO2 emissions by (A) country and (B) continent. Larger point size indicates a greater proportion of protein derived from seafood, while the vertical line represents the median per capita CO2 emission levels. Note the log scale for CO2 emissions.
Notes
- USGCRP. “Impacts, Risks, and Adaptation in the United States: Fourth National Climate Assessment, Volume II: Report-in-Brief.” [Reidmiller, D.R., C.W. Avery, D.R. Easterling, K.E. Kunkel, K.L.M. Lewis, T.K. Maycock, and B.C. Stewart (eds.)]. U.S. Global Change Research Program, Washington, DC, USA, 2018, 186 pp.
- Ibid.
- Cheng, Lijing, John Abraham, Zeke Hausfather, and Kevin E. Trenberth. “How Fast Are the Oceans Warming?” Science 363, no. 6423 (January 11, 2019): 128–29. https://doi.org/10.1126/science.aav7619.
- Honisch, B., et al. “The Geological Record of Ocean Acidification.” Science 335 (2012): 1058-1063. DOI: 10.1126/science.1208277.
- Global Carbon Project. “Carbon budget and trends 2018.” December 5, 2018, www.globalcarbonproject.org/carbonbudget. (Accessed January 5, 2019.)
- Ibid.
- UNEP. “The Emissions Gap Report 2018.” United Nations Environment Programme, Nairobi, November 2018.
- Ibid.
- Cheng, L., Abraham, J., Zhu, J. et al. Record-Setting Ocean Warmth Continued in 2019. Adv. Atmos. Sci. 37, 137–142 (2020). https://doi.org/10.1007/s00376-020-9283-7.
- Ibid.
- Cheng, Lijing, John Abraham, Zeke Hausfather, and Kevin E. Trenberth. “How Fast Are the Oceans Warming?”
- Cheng L. et al. “2018 Continues Record Global Ocean Warming.”
- Honisch, B., et al. “The Geological Record of Ocean Acidification.” Science 335 (2012): 1058-1063. DOI: 10.1126/science.1208277.
- Ullah H, Nagelkerken I, Goldenberg SU, Fordham DA (2018) Climate change could drive marine food web collapse through altered trophic flows and cyanobacterial proliferation. PLOS Biology (2018). doi: 10.1371/journal.pbio.2003446.
- Hausfather, Zeke, Kevin Cowtan, David C. Clarke, Peter Jacobs, Mark Richardson, and Robert Rohde. “Assessing Recent Warming Using Instrumentally Homogeneous Sea Surface Temperature Records.” Science Advances 3, no. 1 (2017): e1601207. https://doi.org/10.1126/sciadv.1601207.
- USGCRP. “Impacts, Risks, and Adaptation in the United States: Fourth National Climate Assessment, Volume II: Report-in-Brief.”
- Hughes, T., J.T. Kerry, S.R. Connolly, A.H. Baird, C.M. Eakin, S.F. Heron, A. Hoey, M. Hoogenboom, M. Jacobson, G. Liu, M.S. Pratchett, W. Skirving, and G. Torda. “Ecological memory modifies the cumulative impact of recurrent climate extremes.“ Nature Climate Change 9 (2018). doi.10.1038/s41558-018-0351.
- Ibid.
- Ibid.
- Gattuso, Jean-Pierre, Alexandre K. Magnan, Laurent Bopp, William W. L. Cheung, Carlos M. Duarte, Jochen Hinkel, Elizabeth Mcleod, et al. “Ocean Solutions to Address Climate Change and Its Effects on Marine Ecosystems.” Frontiers in Marine Science 5 (2018). https://doi.org/10.3389/fmars.2018.00337.
- Hoegh-Guldberg, Ove, Emma V. Kennedy, Hawthorne L. Beyer, Caleb McClennen, and Hugh P. Possingham. “Securing a Long-Term Future for Coral Reefs.” Trends in Ecology & Evolution 33, no. 12 (December 2018): 936–44.
- Ibid.
- Hoegh-Guldberg, O. et al., Reviving the Ocean Economy: The Case for Action – 2015 (Gland, Switzerland: WWF International, 2015).
- Lindsey, Rebecca. “Climate Change: Global Sea Level.” NOAA, August 1, 2018, https://www.climate.gov/news-features/understanding-climate/climate-change-global-sea-level. (Accessed December 15, 2018.)
- Spencer, T., Schuerch, M., Nicholls, R. J., Hinkel, J., Lincke, D., Vafeidis, A. T., et al. “Global coastal wetland change under sea-level rise and related stresses: the DIVA Wetland Change Model.” Global and Planetary Change 139, (2018): 15–30. doi: 10.1016/j.gloplacha.2015.12.018.
- Gattuso, Jean-Pierre, Alexandre K. Magnan, Laurent Bopp, William W. L. Cheung, Carlos M. Duarte, Jochen Hinkel, Elizabeth Mcleod, et al. “Ocean Solutions to Address Climate Change and Its Effects on Marine Ecosystems.”
- Wallace, Tim. “Oceans are absorbing almost all of the globe’s excess heat.” New York Times, September 12, 2016, https://www.nytimes.com/interactive/2016/09/12/science/earth/ocean-warming-climate-change.html. (Accessed December 15, 2018.)
- Ibid.
- Osborne, E.. J. Richter-Menge, and M. Jeffries, eds. “Arctic Report Card 2018.” NOAA, 2018. https://www.arctic.noaa.gov/report-card.
- Ibid.
- Ibid.
- NPR. “Arctic Report Card Documents ‘Cascading Effects’ Of Warming Ocean Temperatures,” December 12, 2018.
https://www.npr.org/2018/12/12/676156154/arctic-report-card-documents-cascading-effects-of-warming-ocean-temperatures. (Accessed December 20, 2018.) - The IMBIE Team “Mass balance of the Antarctic Ice Sheet from 1992 to 2017.” Nature 558 (2018): 219-222. https://doi.org/10.1038/s41586-018-0179-y.
- Nerem, R.S., et al. “Climate-change–driven accelerated sea-level rise detected in the altimeter era.” PNAS 115, no. 9 (2018): 2022-2025. < a href=”https://doi.org/10.1073/pnas.1717312115″ target=”_blank”>https://doi.org/10.1073/pnas.1717312115.
- Pierre-Louis, Kendra. “Antarctica is melting three times as fast as a decade ago.” The New York Times, June 13, 2018. https://www.nytimes.com/2018/06/13/climate/antarctica-ice-melting-faster.html. (Accessed December 20, 2018.)
- Osborne, E.. J. Richter-Menge, and M. Jeffries, eds. “Arctic Report Card 2018.”
- Brown TA, Galicia MP, Thiemann GW, Belt ST, Yurkowski DJ, Dyck MG. “High contributions of sea ice derived carbon in polar bear (Ursus maritimus) tissue.” PLoS ONE 13 (2018): e0191631. https://doi.org/10.1371/journal.pone.0191631
- Bevis, Michael, Christopher Harig, Shfaqat A. Khan, Abel Brown, Frederik J. Simons, Michael Willis, Xavier Fettweis, et al. “Accelerating Changes in Ice Mass within Greenland, and the Ice Sheet’s Sensitivity to Atmospheric Forcing.” Proceedings of the National Academy of Sciences 116, no. 6 (2019): 1934–1939. https://doi.org/10.1073/pnas.1806562116.
- Pinsky, Malin L., Gabriel Reygondeau, Richard Caddell, Juliano Palacios-Abrantes, Jessica Spijkers, and William W. L. Cheung. “Preparing Ocean Governance for Species on the Move.” Science 360, no. 6394 (June 15, 2018): 1189–91. https://doi.org/10.1126/science.aat2360.
- NOAA (National Oceanic and Atmospheric Administration) and Rutgers University. 2016. OceanAdapt. http://oceanadapt.rutgers.edu.
- Ibid.
- Pinsky, Malin L., Gabriel Reygondeau, Richard Caddell, Juliano Palacios-Abrantes, Jessica Spijkers, and William W. L. Cheung. “Preparing Ocean Governance for Species on the Move.”
- Parker, Robert W. R., Julia L. Blanchard, Caleb Gardner, Bridget S. Green, Klaas Hartmann, Peter H. Tyedmers, and Reg A. Watson. “Fuel Use and Greenhouse Gas Emissions of World Fisheries.” Nature Climate Change 8, no. 4 (April 2018): 333–37. https://doi.org/10.1038/s41558-018-0117-x; Comer, B., N. Olmer, X. Mao, B. Roy, and D. Rutherford. “Black Carbon Emissions and Fuel Use in Global Shipping.” ICCT: Washington, DC, 2017.
- Gabbatiss, Josh. “Carbon emissions from global shipping to be halved by 2050, IMO says.” The Independent , April 13, 2018. https://www.independent.co.uk/environment/ships-emissions-carbon-dioxide-pollution-shipping-imo-climate-change-a8303161.html. (Accessed December 20, 2018.)
- The Maritime Executive. “IMO Agrees to CO2 Emissions Target.” March 13, 2014, https://www.maritime-executive.com/article/imo-agrees-to-co2-emissions-target. (Accessed December 20, 2018.)
- Press Release, Maersk. “Maersk sets net zero CO2 emissions target by 2050.” December 4, 2018. https://www.maersk.com/news/.
- Parker, Robert W. R., Julia L. Blanchard, Caleb Gardner, Bridget S. Green, Klaas Hartmann, Peter H. Tyedmers, and Reg A. Watson. “Fuel Use and Greenhouse Gas Emissions of World Fisheries.” Nature Climate Change 8, no. 4 (April 2018): 333–37. https://doi.org/10.1038/s41558-018-0117-x.
- Ibid.
- Gattuso, Jean-Pierre, Alexandre K. Magnan, Laurent Bopp, William W. L. Cheung, Carlos M. Duarte, Jochen Hinkel, Elizabeth Mcleod, et al. “Ocean Solutions to Address Climate Change and Its Effects on Marine Ecosystems.”
- UNEP. “The Emissions Gap Report 2018.”
- IPCC. “Summary for Policymakers. In: Global Warming of 1.5°C. An IPCC Special Report on the impacts of global warming of 1.5°C above pre-industrial levels and related global greenhouse gas emission pathways, in the context of strengthening the global response to the threat of climate change, sustainable development, and efforts to eradicate poverty.” [Masson-Delmotte, V., P. Zhai, H.-O. Pörtner, D. Roberts, J. Skea, P.R. Shukla, A. Pirani, W. Moufouma-Okia, C. Péan, R. Pidcock, S. Connors, J.B.R. Matthews, Y. Chen, X. Zhou, M.I. Gomis, E. Lonnoy, T. Maycock, M. Tignor, and T. Waterfield (eds.)]. World Meteorological Organization, Geneva, Switzerland, 2018, 32 pp.
- M. Mengel, et al. “Committed sea-level rise under the Paris Agreement and the legacy of delayed mitigation action.” Nature Communications 9 (2018).
- Falk, J. et al. “Exponential Climate Action Roadmap.” Future Earth, Sweden, September 2018.
- Sumaila, R. et al. “Benefits of the Paris Agreement to ocean life, economies, and people.” Science Advances 5, no. 2 (2019). DOI: 10.1126/sciadv.aau3855.