Jump to:
Key Findings
It is an adage often repeated but frequently underappreciated: the ocean is intrinsically connected to sustaining life on Earth, from regulating the planet’s temperature to generating more than half of the oxygen that humans breathe. For several decades, the human footprint on the ocean has been expanding due to overfishing, coastal development and associated habitat loss and pollution, and the combined activities of marine industries—particularly shipping and oil and gas but also emerging industries such as deep-sea mining. The combined threats to the ocean are cumulative, are sometimes difficult to document (e.g., scale of pollutants), and can interact with each other in unpredictable ways.
One of the most profound changes in recent years as it relates to the ocean is that the scientific evidence base for observed and projected impacts of climate change has increased rapidly.1, 2, 3, 4 The impacts of climate change on the ocean are manifesting in ways that are both subtle (e.g., ocean acidification, marine heat waves, shifting fish stocks, rising sea levels) and starkly perceptible—from extreme weather events such as super typhoons to accelerated melting of ice in the polar regions to more frequent and extensive coral reef bleaching. The effects of climate change on the marine environment indisputably are here, and they are following an increasing trendline.
The following high-level trends point to recent and ongoing changes in the ocean. Readers are invited to explore additional statistics and analysis by topic area, shared in greater depth in the respective chapters on the site.
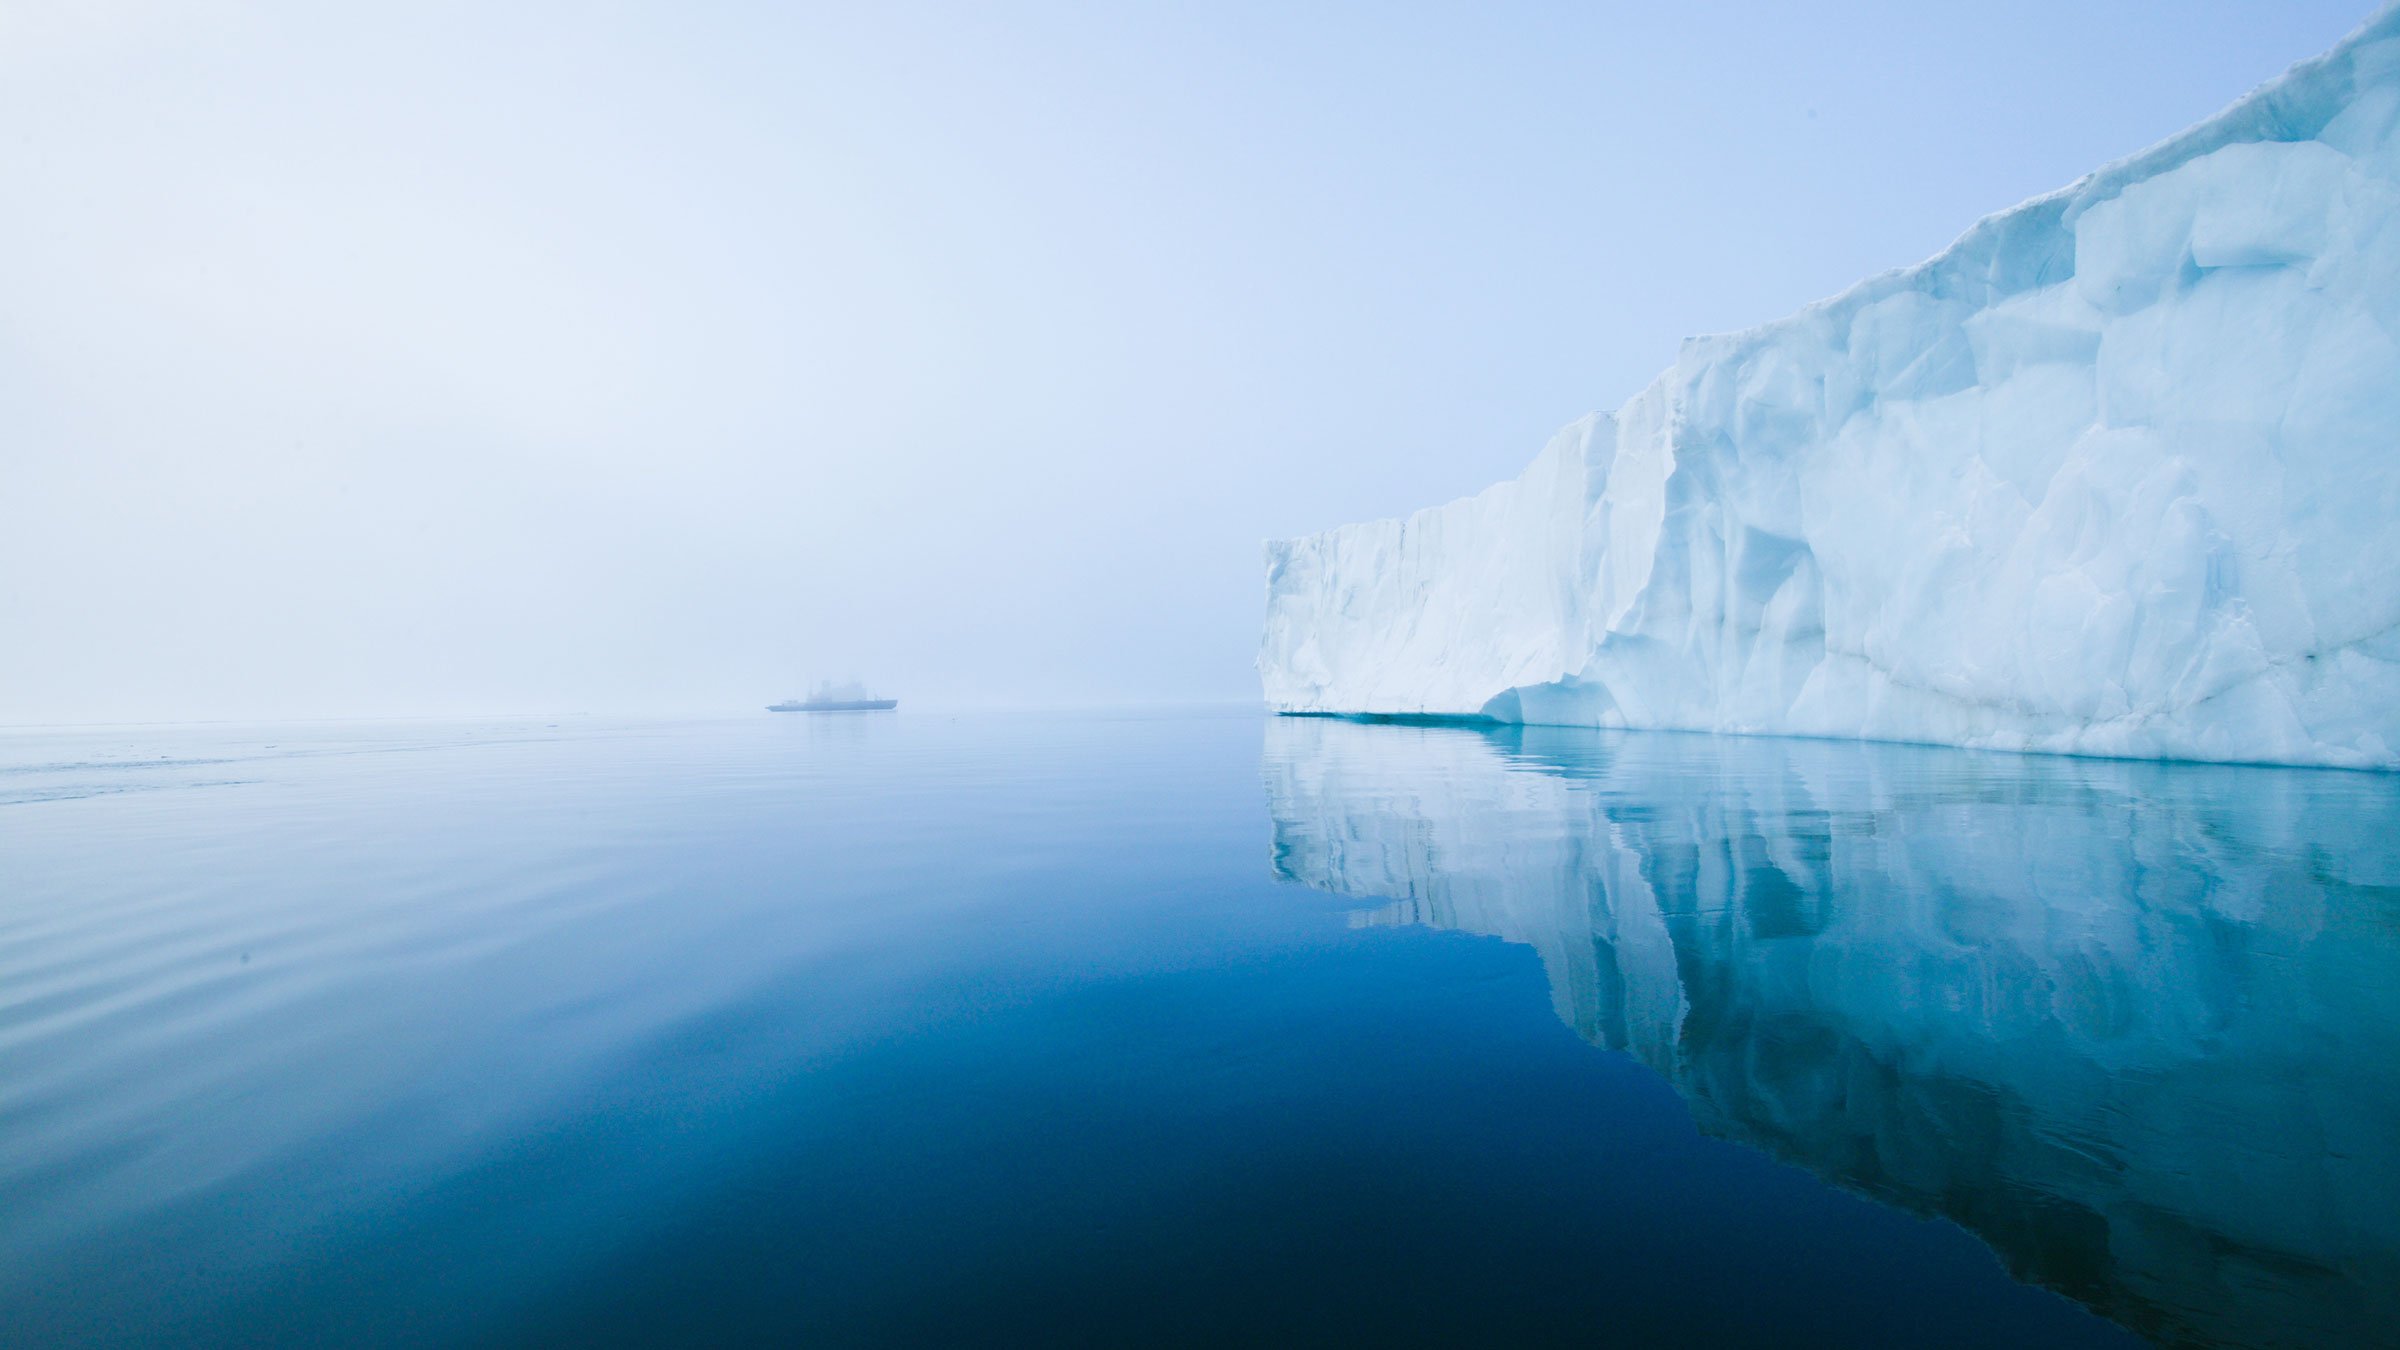
Photo: virythtpehjljd89/stock.adobe.com
Climate Change
The ocean has played a crucial role as a climate regulator, having absorbed 93 percent of excess heat energy since the 1970s, buffering the planet from soaring temperatures.5 The year 2019 was the warmest year on record for ocean heat content, while 2014–2018 were the five warmest years in the ocean since 1958.6 New research indicates that the ocean is absorbing excess heat 40 percent faster than previously predicted, suggesting that global warming may be more advanced than previously thought.7 The global surface temperature has warmed 1 degree Celsius (1.8 degrees Fahrenheit) since the late 1880s. The current emissions path is projected to lead to 1.5 degrees Celsius of warming by 2040, and 4 degrees Celsius by 2100 under a business-as-usual scenario.8 While scientific evidence around indicators of climate change has become increasingly robust and unequivocal, there is a current lack of scientific understanding as to self-reinforcing feedback loops and the “known unknown” of tipping points, which represent critical thresholds beyond which the impacts of rapid climate change become difficult to reverse. A recent study suggests that Greenland’s massive ice sheet is melting four times faster than previously thought, potentially approaching a dangerous tipping point.9 Ice melt from Greenland could raise global sea levels by 23 feet.10 Although this change would occur on the order of centuries, scientists warn that the meltdown of Greenland could be irreversible within the span of a few decades if a critical warming threshold is crossed.
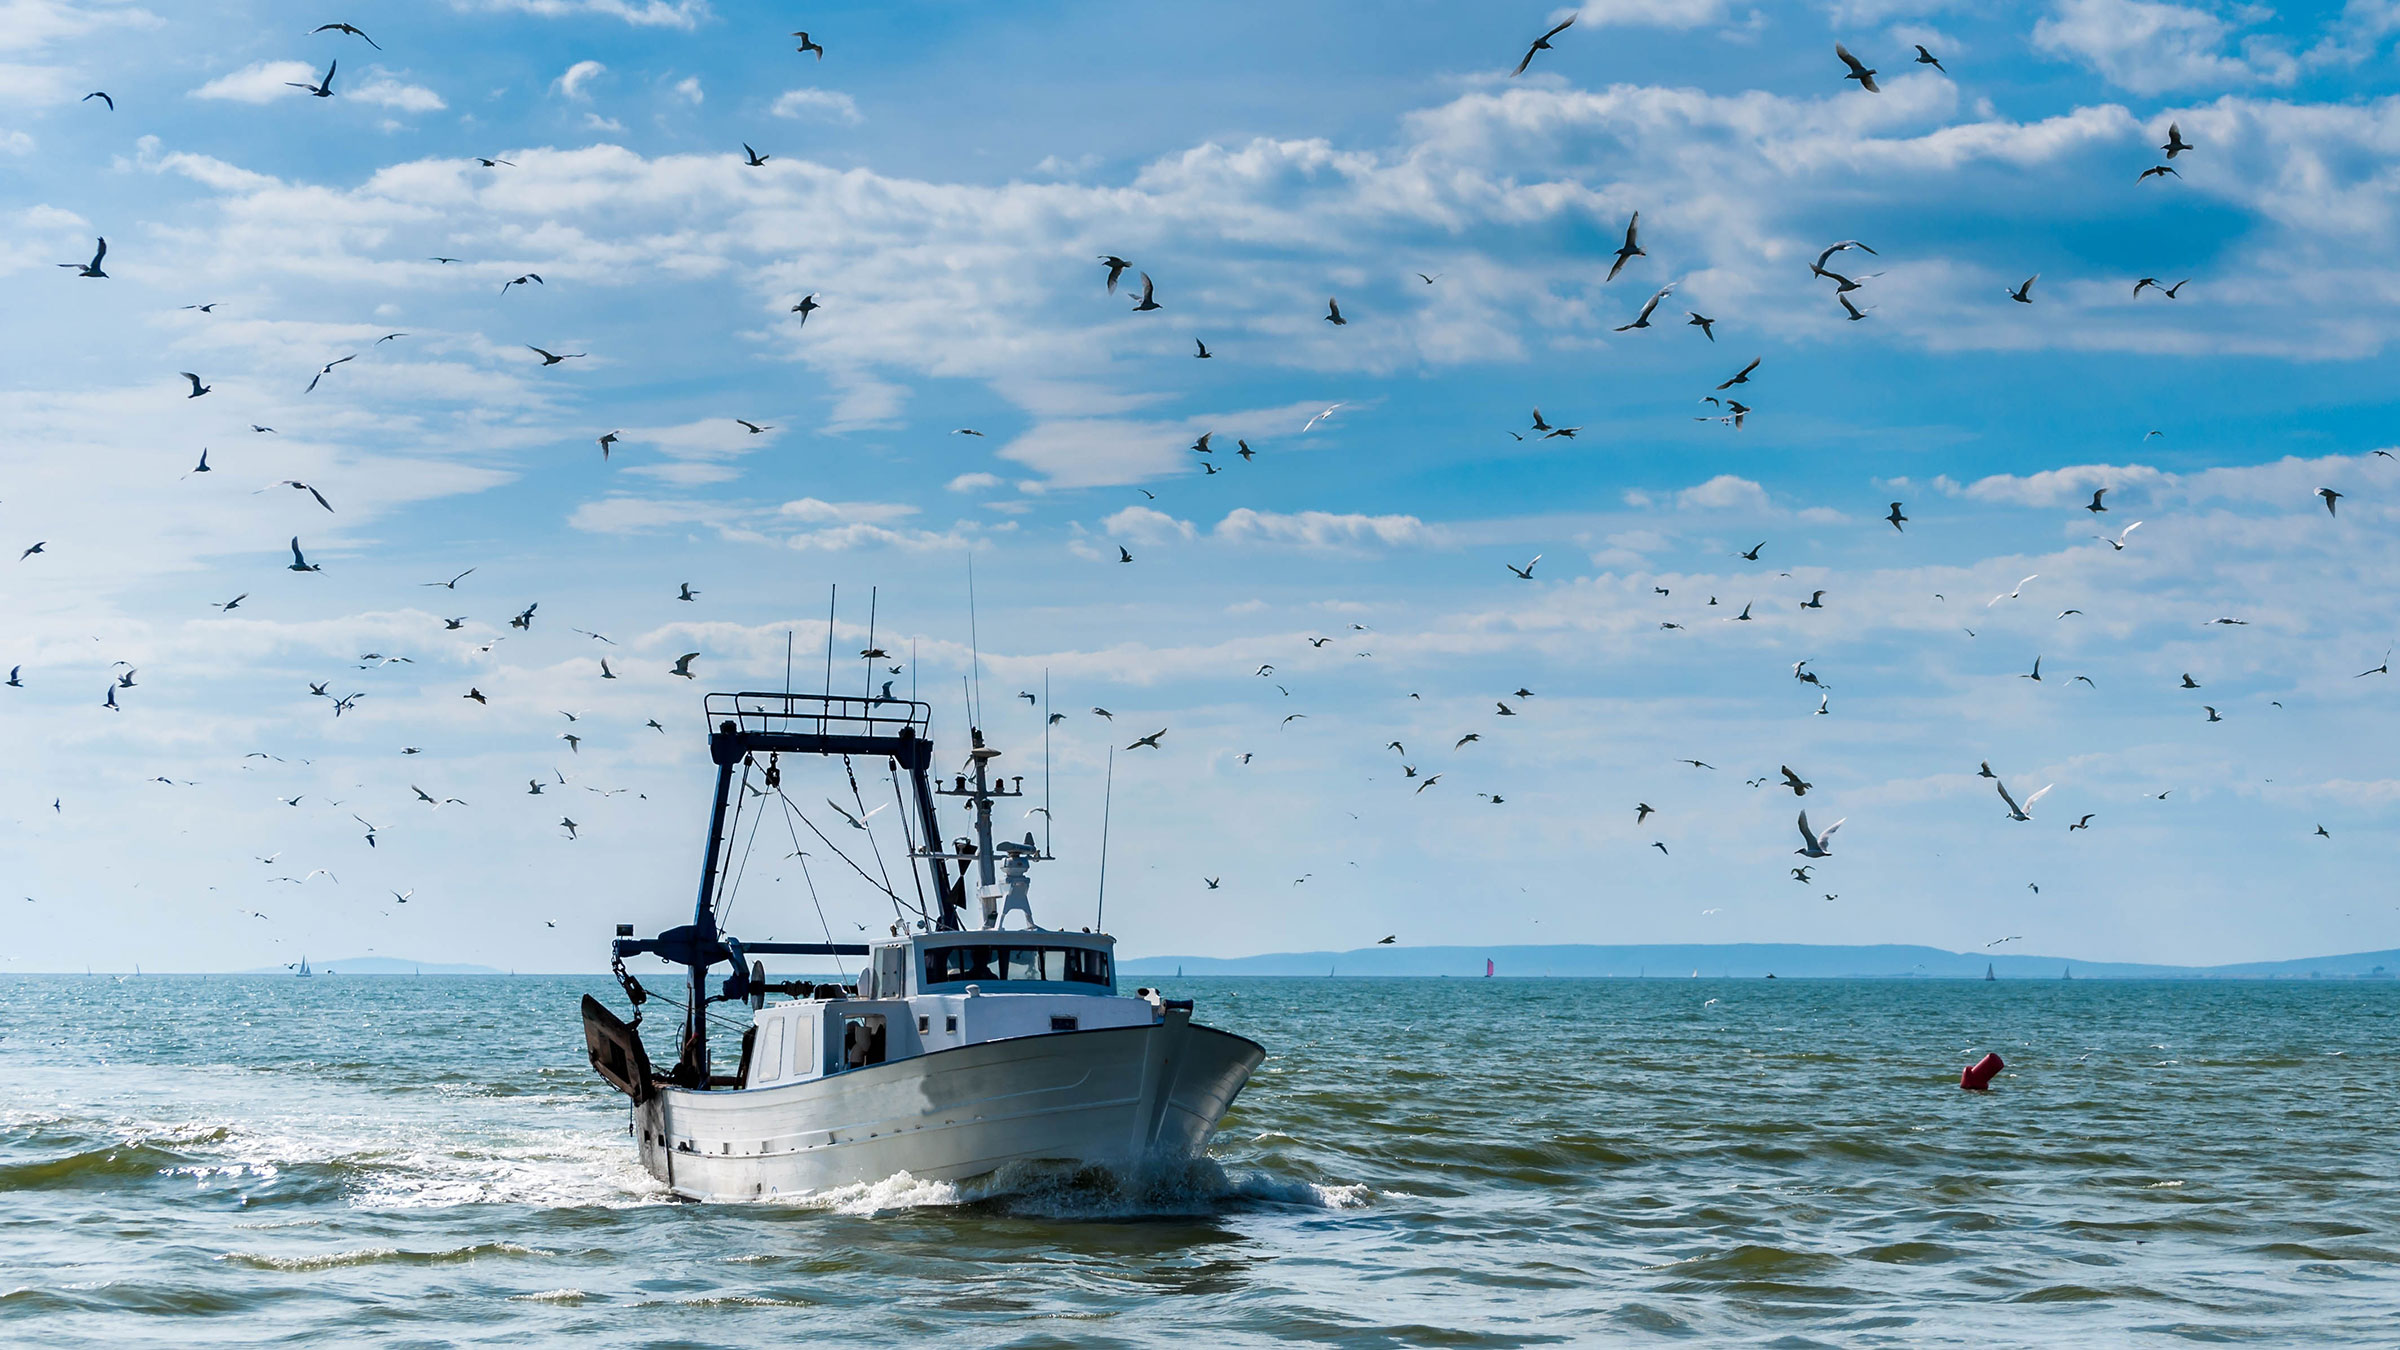
Photo: Bernard Girardin / Adobe Stock
Unsustainable Fishing and Farming
Global trends in wild capture fisheries are well documented. Since the mid-1990s, wild capture landings have been stable or slightly declining at around 90 million tons.11 Catch reconstruction methodologies suggest this number is roughly 20-35 percent higher than officially reported figures.12, 13 This general decline has occurred in spite of significant increases in overall fishing effort over the same period.14 Approximately 80 percent of fisheries are considered fully fished or overfished, though the proportion of stocks undergoing rebuilding has increased slightly in recent years.15 Illegal, unreported, and unregulated (IUU) fishing remains a “dark side” of global fisheries, potentially accounting for 25 percent of global landings.16 Recent research suggests the level of IUU fishing has stabilized in recent years, though it should be noted that there is considerable uncertainty around global estimates of IUU. The practice of distant-water fishing—defined as fishing in areas far removed from a country’s domestic waters—has been dominated by a small number of countries in recent years, particularly Taiwan, South Korea, Spain, and China.17 These countries continuously expanded the mean distance to fishing grounds by more than 2,000 km (1,240 miles) from 1950 to 2014.18 Patterns of overfishing remain tightly associated with insufficient fisheries management capacity.19 The 2016 and 2018 Fisheries Management Index (FMI) suggests that three factors are the strongest predictors of a country’s stock health: effectiveness of stock assessments, strength of fishing pressure limits, and comprehensiveness of enforcement programs.20, 21
Aquaculture will make up an increasing portion of seafood for human consumption in years to come. As capture fisheries production has plateaued, aquaculture production has driven continued growth in global seafood production, accounting for 47 percent of combined production in 2016.22 The aquaculture sector reached a major milestone in 2014 when it provided more fish for human consumption than did capture fisheries. By 2030, aquaculture is projected to provide 60 percent of fish for human consumption.23 Most aquaculture production (i.e., algae, molluscs, herbivorous freshwater fish) is considered environmentally benign, apart from local carrying capacity constraints. More acute environmental concerns with aquaculture are concentrated around a handful of issues. The conversion of mangrove habitat to fish or shrimp ponds remains a concern particularly in Southeast Asia, but the global and regional conversion rate of mangroves has been declining since the 1990s.24 In terms of aquaculture’s dependence on wild fisheries for feed, the use of fishmeal and fish oil in aquaculture has declined steadily in recent decades.25 There is limited evidence to clearly indicate whether aquaculture is driving pressure on wild fisheries.
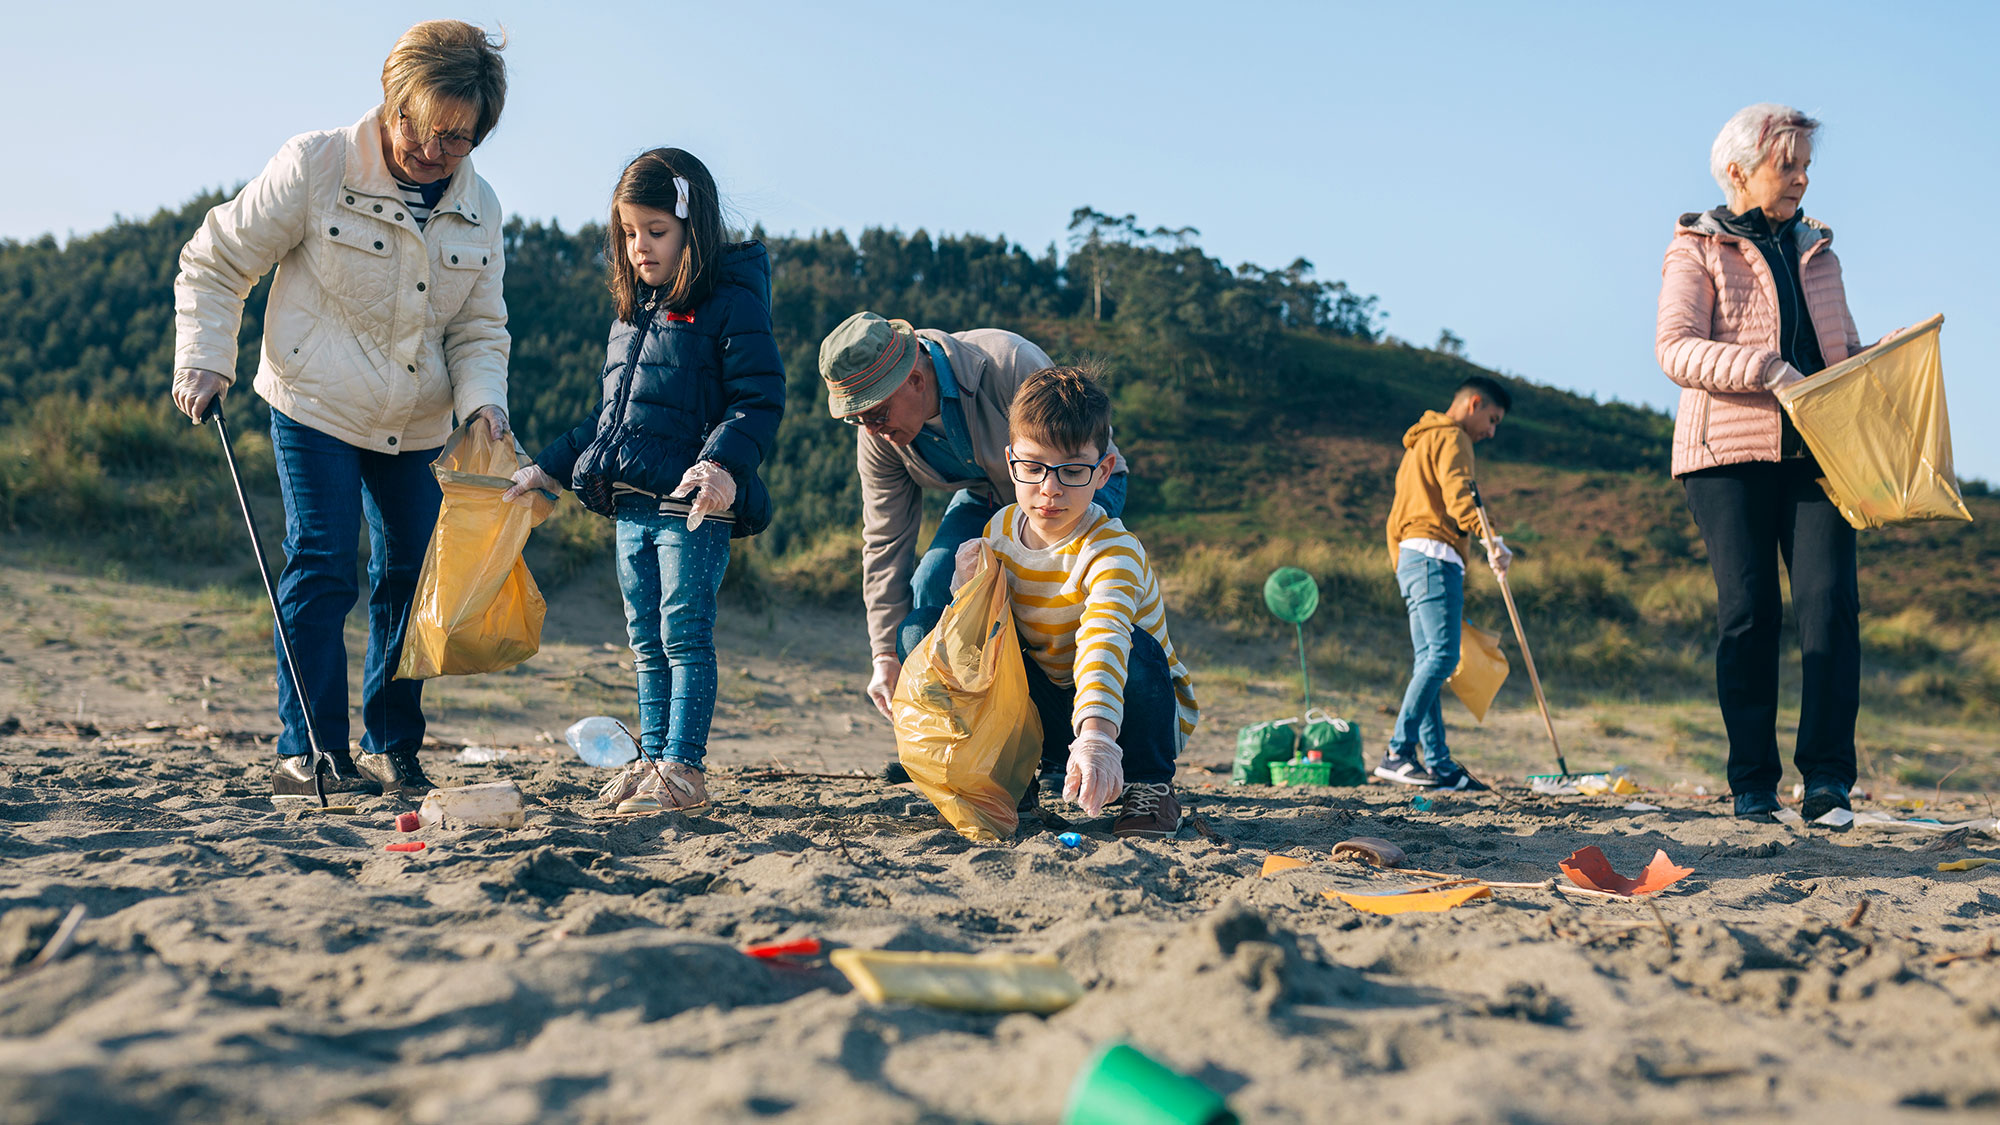
Photo: doble-d/iStock
Pollution
The ocean has historically been treated as a dumping ground for society’s wastes, under the guise that “dilution is the solution to pollution.” While some of this pollution is highly visible (e.g., oil and large plastics), other types are less conspicuous but similarly insidious (e.g., toxins and microplastics). The aggregate effect of all pollution on the marine environment is not fully known due to the diffuse nature of sources and incomplete data, but indicators suggest that it is likely worsening. Sewage pollution, which is a mounting but often overlooked threat to both ocean and societal health, makes up the largest percentage of coastal pollution worldwide.26 Roughly 80 percent of the world’s wastewater is discharged—untreated or only partially treated—into lakes, rivers, streams, and the ocean.27 The impacts of sewage pollution include degradation to critical habitats and ecosystems, mortality for marine life, harm to human health, and damage to coastal identities and livelihoods. In terms of the large-scale input of nutrients, over 480 nutrient pollution hotspots have been identified globally, with notable persistent challenges in the North Sea, Gulf of Mexico, eastern United States, and East Asia. The best available estimates suggest annual plastic flows to the ocean are in the range of 9 million to 14 million metric tons per year.28 Under a business-as-usual scenario, the annual flow of plastic into the ocean is projected to nearly triple by 2040 to roughly 29 million metric tons per year.29 The extent and quality of waste management remains a key determinant in terms of which countries contribute the most significant plastic waste inputs per capita from land into the ocean.
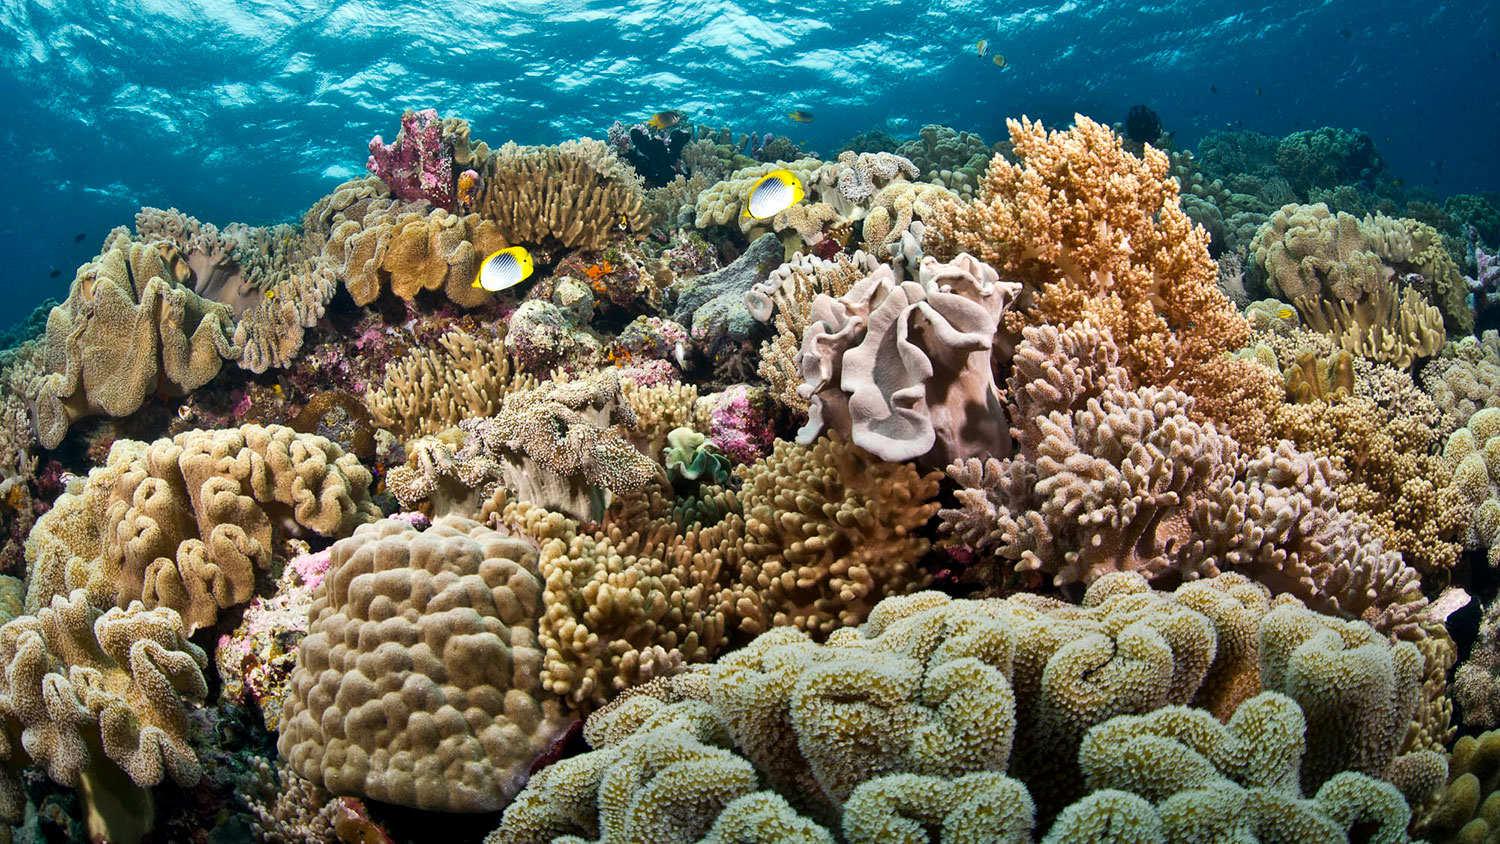
Photo: Erik Lukas / Coral Reef Image Bank
Habitat and Biodiversity
Marine habitats and biodiversity are declining at an unprecedented rate due to human pressures. The primary drivers are overexploitation, human pressures in coastal environments (shoreline hardening, development, and pollution), and increasingly, climate change impacts including sea-level rise. The natural capacity of the ocean to provide ecosystem services and goods will continue to weaken without action to maintain and restore marine habitats and biodiversity. To address losses in biodiversity and marine habitat, the international community has increasingly focused on the protection of marine areas. The MPA designation has risen rapidly in recent years. About 5.7 percent of the world’s ocean has been protected in implemented Marine Protected Areas (MPAs).30 Global coordination to protect biodiversity for the next decade is gaining momentum and will be an area of heightened focus as countries gather at the Conference of the Parties to the Convention on Biological Diversity in Kunming in May 2021. A growing coalition of scientists, Indigenous peoples, and advocates are calling for an updated global target to protect at least 30 percent of the ocean by 2030. Even as MPAs have proliferated in number and coverage in recent years, recent research indicates that many existing MPAs lack sufficient budget and staff capacity.31 Financial and staff capacity are directly tied to the health of fish populations: MPAs with adequate staff and budget enjoyed fish recoveries that were nearly three times as large as recoveries in MPAs without adequate capacity.32
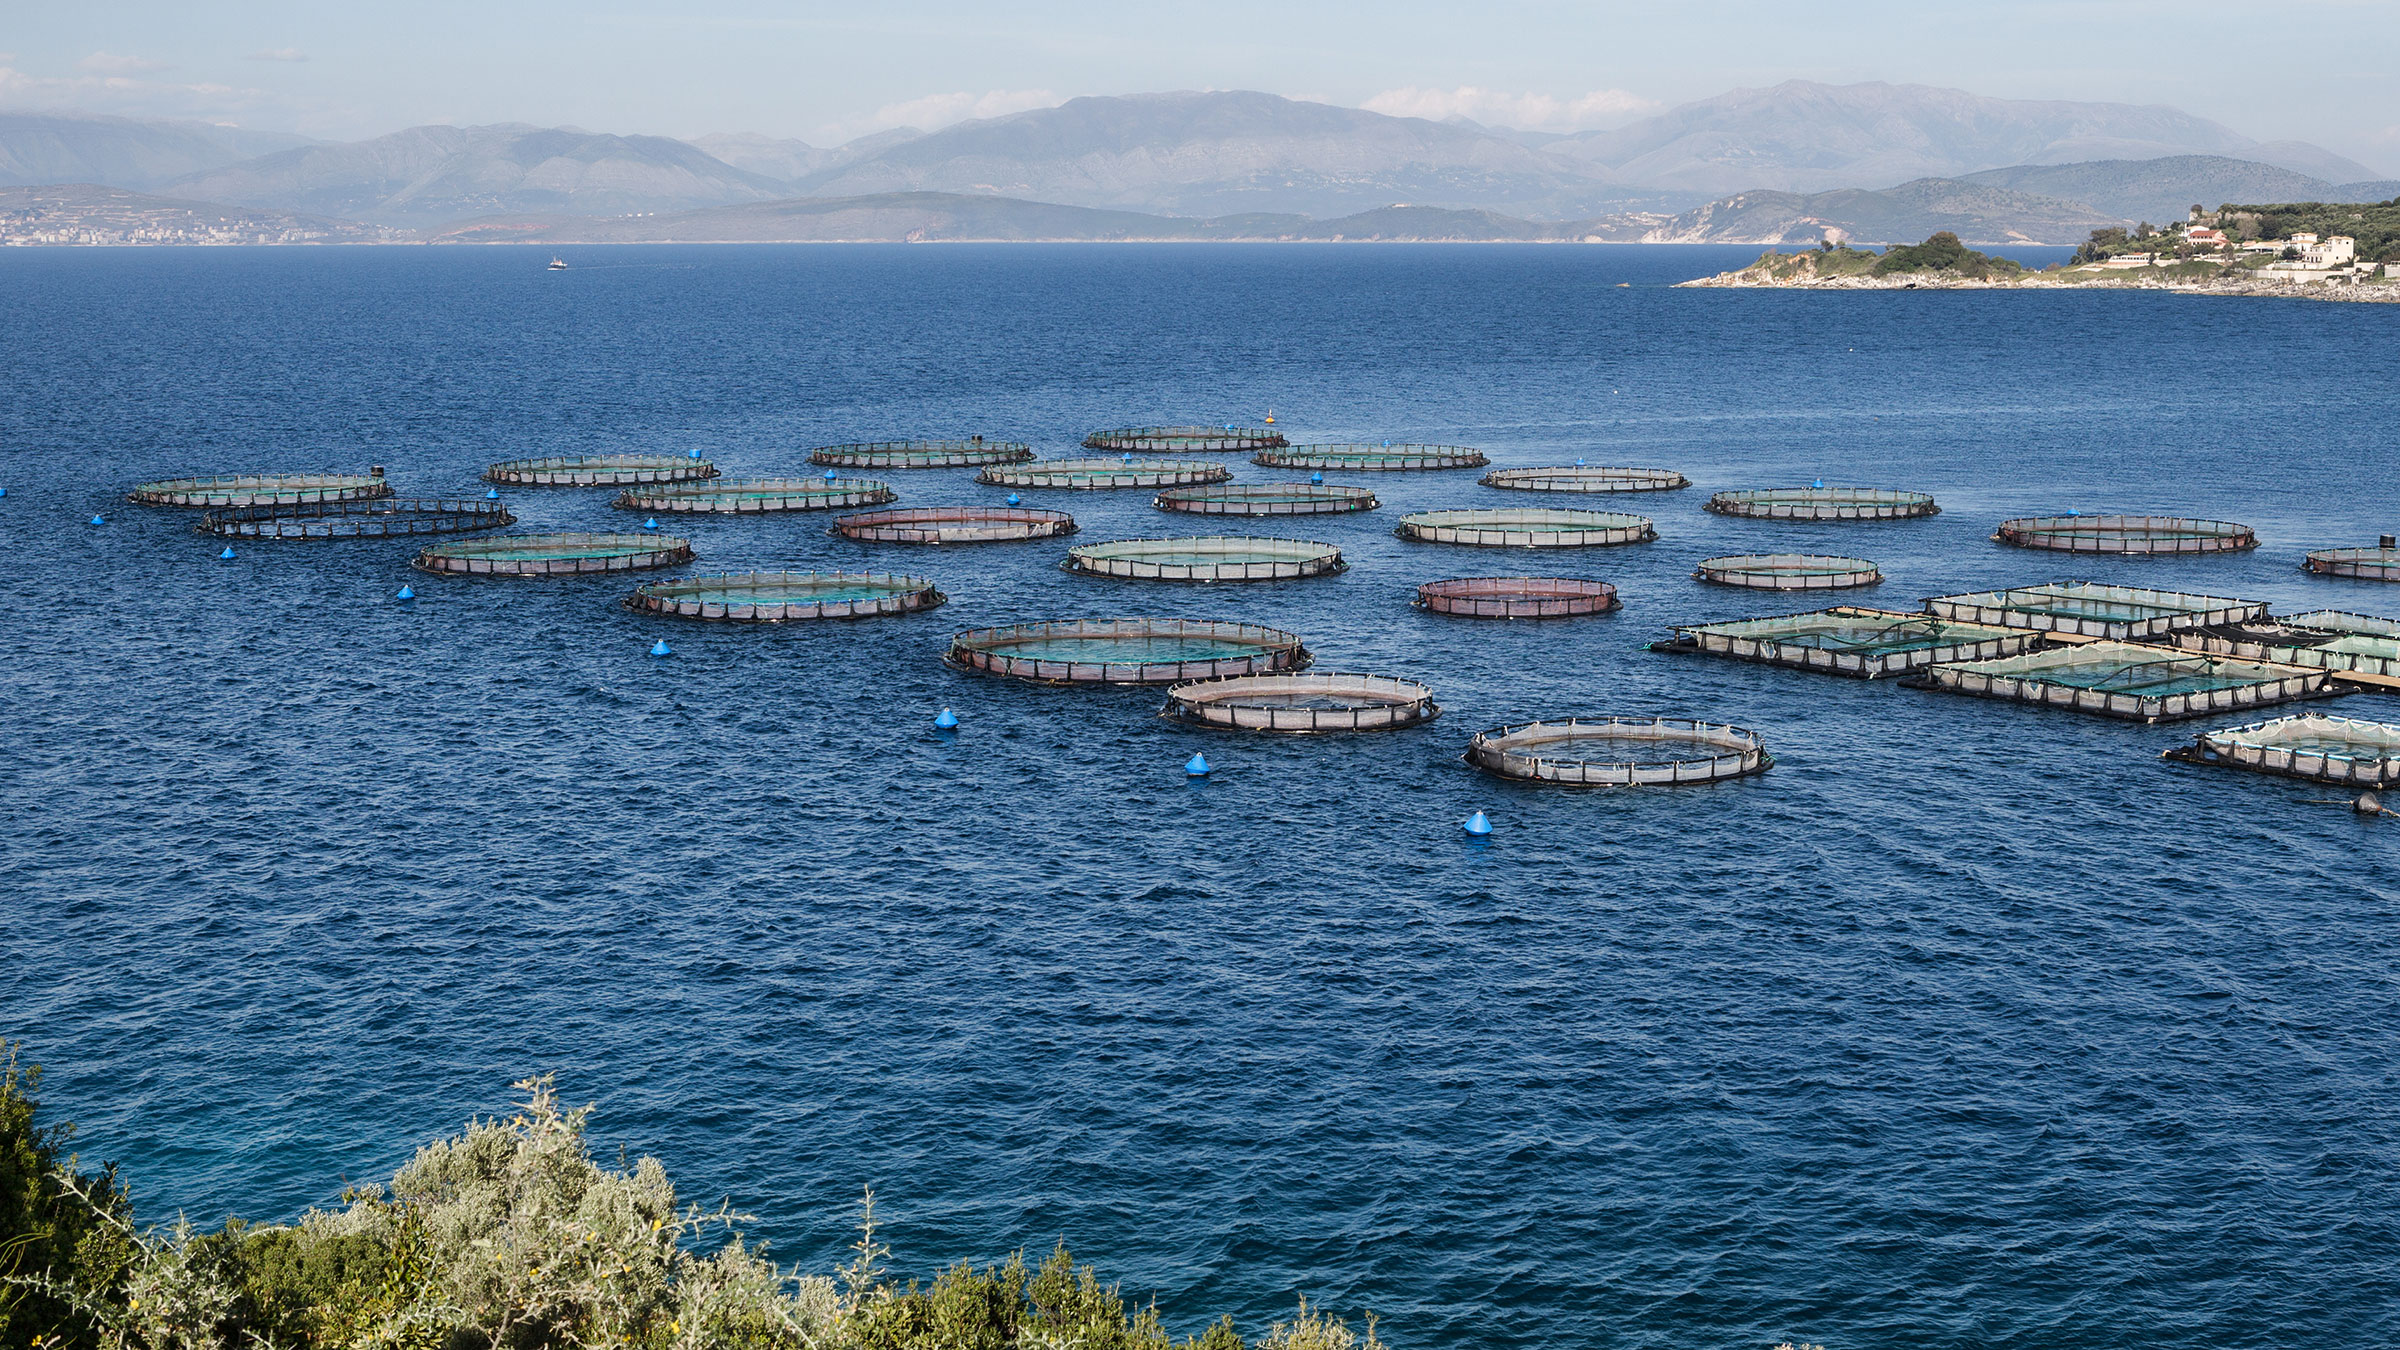
Photo: wabeno/stock.adobe.com
Industrial Impacts
The level of industrial activity on the ocean is expected to increase in coming years. According to the OECD, ocean industries generated USD 1.5 trillion in economic activity in 2010; this amount is expected to double to USD 3 trillion in 2030.33 Some sources refer to the trendline of human expansion into the ocean as the “blue acceleration.”34 As diverse and sometimes competing user groups seek to access food, material, and space in the ocean, there are calls to carefully consider concerns around equity and sustainability. There are several industries (both long-standing and emerging) that are active on the ocean. Shipping and offshore oil and gas represent the two largest sectors economically and have the most significant ecological footprint on the marine environment outside of fishing. Among sectors with a smaller but still notable footprint, marine aquaculture has grown rapidly over the last two decades. Several other industries—including marine renewables, deep-sea mining, and biotechnology—are on the horizon.
Photo: irabell/iStock
Funding
This report also considered how the marine conservation funding community has responded to the range of threats facing the ocean in terms of recent funding trends. Approximately USD 1.3 billion in grant funding was directed to marine conservation in 2016.35 Half of these funds originated from foundations and half of the funds came in the form of official development assistance from bilateral and multilateral aid agencies. Following a trend similar to that of previous years, these two sectors have provided a comparable amount of funding to marine conservation, but they have targeted different geographic and issue areas. Philanthropy still invests heavily in North America and cross-cutting science and global initiatives; these priorities made up 80 percent of ocean-related foundation grantmaking in 2015 and 2016.36 Given its focus on poverty alleviation and economic development, the development aid sector contributed 40 percent of its marine conservation grantmaking to Africa in 2015 and 2016. Asia, Oceania, and the Middle East accounted for a combined 45 percent of development aid grantmaking during the same period. Other funding streams to NGOs (including government grants, donations from major donors or individuals, membership dues, bequests, and contracts) represent an additional source of funding for ocean conservation. Based on a coarse sampling of the largest ocean NGOs, initial analysis suggests that non-foundation funding sources for NGOs may be roughly equivalent to annual foundation contributions for marine conservation, adding another USD 600 million in funding for the ocean per year, bringing the annual funding total closer to USD 2 billion.37
Notes
- IPCC. “Summary for Policymakers. In: Global Warming of 1.5°C. An IPCC Special Report on the impacts of global warming of 1.5°C above pre-industrial levels and related global greenhouse gas emission pathways, in the context of strengthening the global response to the threat of climate change, sustainable development, and efforts to eradicate poverty.” [Masson-Delmotte, V., et al. (eds.)]. World Meteorological Organization, Geneva, Switzerland, 2018, 32 pp.
- Gattuso, Jean-Pierre, Alexandre K. Magnan, Laurent Bopp, William W. L. Cheung, Carlos M. Duarte, Jochen Hinkel, Elizabeth Mcleod, et al. “Ocean Solutions to Address Climate Change and Its Effects on Marine Ecosystems.” Frontiers in Marine Science 5 (2018). https://doi.org/10.3389/fmars.2018.00337.
- Poloczanska ES, Burrows MT, Brown CJ, García Molinos J, Halpern BS, Hoegh-Guldberg O, Kappel CV, Moore PJ, Richardson AJ, Schoeman DS and Sydeman WJ. “Responses of Marine Organisms to Climate Change across Oceans.” Frontiers in Marine Science (2016). doi: 10.3389/fmars.2016.00062.
- Glaser, G. “Strengthening the scientific evidence base of a new climate agreement.” Ecosystem Health and Sustainability (2015). https://doi.org/10.1890/EHS15-0034.1.
- USGCRP. “Impacts, Risks, and Adaptation in the United States: Fourth National Climate Assessment, Volume II: Report-in-Brief.” [Reidmiller, D.R., C.W. Avery, D.R. Easterling, K.E. Kunkel, K.L.M. Lewis, T.K. Maycock, and B.C. Stewart (eds.)]. U.S. Global Change Research Program, Washington, DC, USA, 2018, 186 pp.
- Cheng, L., Abraham, J., Zhu, J. et al. Record-Setting Ocean Warmth Continued in 2019. Adv. Atmos. Sci. 37, 137–142 (2020). https://doi.org/10.1007/s00376-020-9283-7
- Ibid.
- UNEP. “The Emissions Gap Report 2018.” United Nations Environment Programme, Nairobi, November 2018.
- Bevis, Michael, Christopher Harig, Shfaqat A. Khan, Abel Brown, Frederik J. Simons, Michael Willis, Xavier Fettweis, et al. “Accelerating Changes in Ice Mass within Greenland, and the Ice Sheet’s Sensitivity to Atmospheric Forcing.” Proceedings of the National Academy of Sciences 116, no. 6 (2019): 1934–1939. https://doi.org/10.1073/pnas.1806562116.
- Ibid.
- FAO, ed. The State of World Fisheries and Aquaculture 2018. Rome, 2018.
- Pauly D. and Zeller D., editors. Sea Around Us Concepts, Design and Data, www.seaaroundus.org, 2015.
- Watson, Reg A., and A. Tidd. “Mapping Nearly a Century and a Half of Global Marine Fishing: 1869–2015.” Marine Policy 93 (July 2018): 171–77. https://doi.org/10.1016/j.marpol.2018.04.023.
- J.D. Bell, R.A. Watson, Y. Ye. “Global fishing capacity and fishing effort from 1950–2012.” Fish and Fisheries. 18 (3) (2017) 489–505.
- Pauly D. and Zeller D., eds. Sea Around Us Concepts, Design and Data.
- Watson, Reg A., and A. Tidd. “Mapping Nearly a Century and a Half of Global Marine Fishing: 1869–2015.”
- Tickler, David, Jessica J. Meeuwig, Maria-Lourdes Palomares, Daniel Pauly, and Dirk Zeller. “Far from Home: Distance Patterns of Global Fishing Fleets.” Science Advances 4, no. 8 (August 2018): eaar3279. https://doi.org/10.1126/sciadv.aar3279.
- Ibid.
- Melnychuk, Michael C., Emily Peterson, Matthew Elliott, and Ray Hilborn. “Fisheries Management Impacts on Target Species Status.” Proceedings of the National Academy of Sciences 114, no. 1 (January 3, 2017): 178–83. https://doi.org/10.1073/pnas.1609915114.
- Ibid.
- Melnychuk, M., C. Ashbrook, M. Pons, R. Hilborn. “Assessing the effectiveness and recent changes in fisheries management systems of 28 fishing nations with the Fisheries Management Index survey.” University of Washington. August 27, 2018.
- FAO, ed. The State of World Fisheries and Aquaculture 2018.
- Ibid.
- Richards, Daniel R., and Daniel A. Friess. “Rates and Drivers of Mangrove Deforestation in Southeast Asia, 2000–2012.” Proceedings of the National Academy of Sciences, no. 2 (January 12, 2016): 344–49. https://doi.org/10.1073/pnas.1510272113.
- World Bank, Fish to 2030: Prospects for Fisheries and Aquaculture, World Bank Report Number 83177-GLB, Dec. 2013.
- Wear, Stephanie L., and Rebecca Vega Thurber. “Sewage Pollution: Mitigation Is Key for Coral Reef Stewardship.” Annals of the New York Academy of Sciences 1355, no. 1 (2015): 15–30. https://doi.org/10.1111/nyas.12785.
- The United Nations World Water Development Report 2017. Wastewater the Untapped Resource.” United Nations World Water Assessment Programme, 2017. http://www.unesco.org/new/en/natural-sciences/environment/water/wwap/wwdr/.
- Pew and SYSTEMIQ. “Breaking the Plastic Wave: A Comprehensive Assessment of Pathways Towards Stopping Ocean Plastic Pollution.” https://www.pewtrusts.org/-/media/assets/2020/07/breakingtheplasticwave_report.pdf.
- Ibid.
- Marine Conservation Institute, MPAtlas (Seattle, 2020), www.mpatlas.org.
- Gill, D.A. et al. “Capacity shortfalls hinder the performance of marine protected areas globally.” 2017. Nature (543): 665-671.
- Ibid.
- OECD. “The Ocean Economy in 2030.” OECD Publishing, Paris, 2016. http://dx.doi.org/10.1787/9789264251724-en.
- Jouffray, J.-B., R. Blasiak, A.V. Norström, H. Österblom and M. Nyström. 2020. “The Blue Acceleration: The Trajectory of Human Expansion Into the Ocean.” One Earth 2 (1): 43–54.
- Analysis by CEA Consulting, 2018. Prepared for “Our Shared Seas: Global ocean data and trends for informed action and decision-making,” 2019.
- Ibid.
- Ibid.
- Ibid.